IMAGE

Figure 3

ID
ZDB-IMAGE-191230-193
Source
Figures for Molagoda et al., 2019
Image
Figure Caption

Figure 3

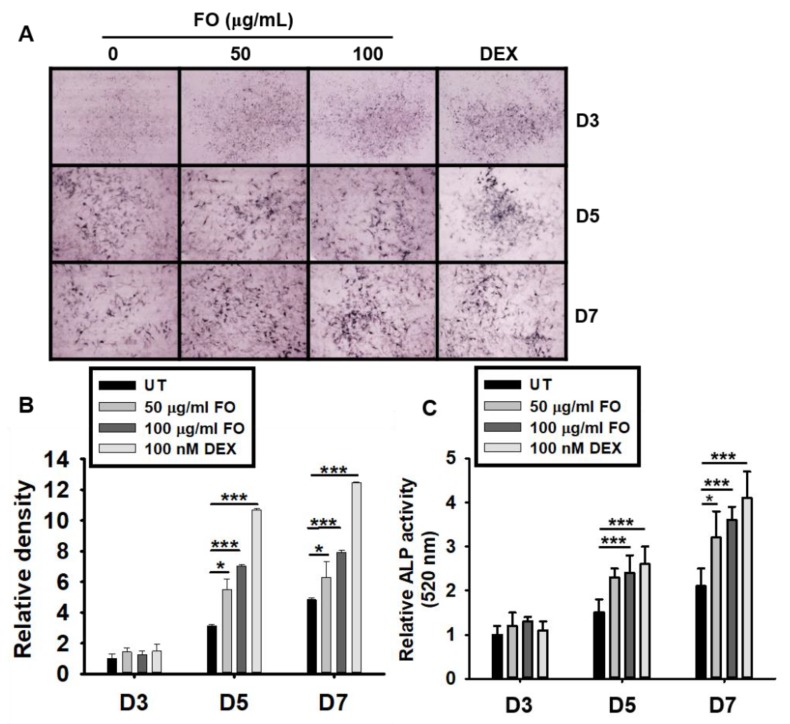
FO upregulates ALP expression and activity in preosteoblast MC3T3-E1 cells. (A) MC3T3-E1 cells were treated with FO (50 µg/mL and 100 µg/mL) or DEX (100 nM) for 7 days. Representative images from three biological replicates were collected using the Toup View software after staining the cell for ALP activity (as described in the Materials and Methods section) on day 3 (D3), day 5 (D5), and day 7 (D7). (B) The relative ALP staining density was represented using mean integrated pixel density. (C) ALP activity was measured at 520 nm using a tartrate-resistant acid phosphatase (TRACP) & alkaline phosphatase (ALP) assay kit. Significant differences among the groups were determined using the one-way ANOVA followed by Bonferroni correction. All data are presented as mean ± SEM (*** p < 0.001 and * p < 0.05 versus untreated group). FO; fermented extract of C. gigas and DEX; dexamethasone.

Acknowledgments
This image is the copyrighted work of the attributed author or publisher, and ZFIN has permission only to display this image to its users. Additional permissions should be obtained from the applicable author or publisher of the image. Full text @ Biomolecules