IMAGE

Figure 1

ID
ZDB-IMAGE-191230-191
Source
Figures for Molagoda et al., 2019
Image
Figure Caption

Figure 1

FO increases mitochondrial activity in preosteoblast MC3T3-E1 cells and decreases total cell number. MC3T3-E1 cells were treated with FO (0–200 µg/mL) or 100 nM DEX for 7 days. (
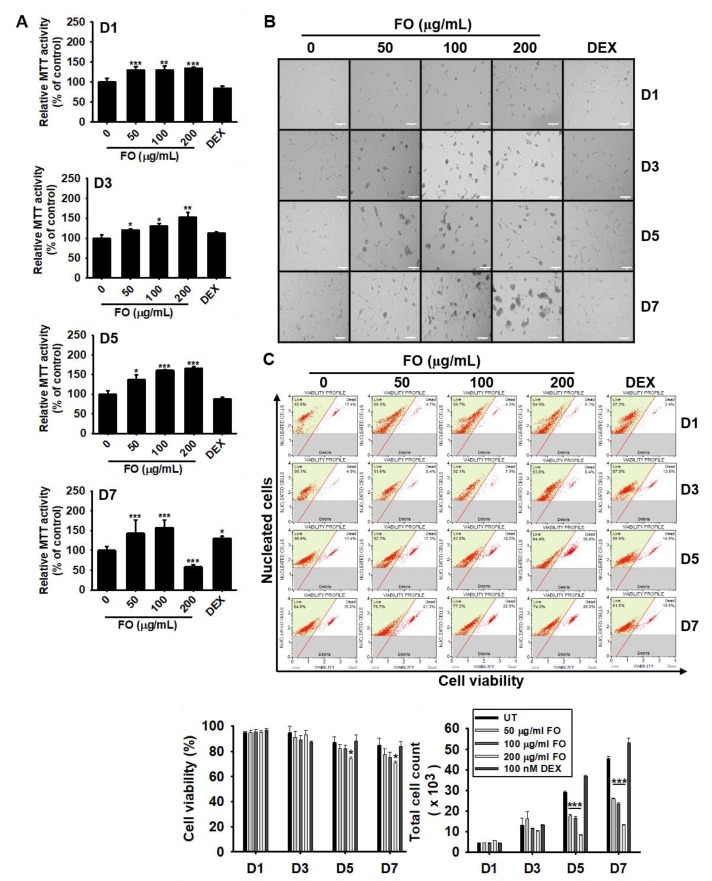
A) Mitochondrial activity was measured on day 1 (D1), day 3 (D3), day 5 (D5), and day 7 (D7), and (B) cell images were collected by Ezscope i900PH phase contrast microscope (×10). Scale bar shows 100 μm. (C) Under the same experimental conditions, cell viability and total cell count were measured using flow cytometric analysis. Significant differences among the groups were determined using the one-way ANOVA followed by Bonferroni correction. All data are presented as mean ± SEM (*** p < 0.001, ** p < 0.01, and * p < 0.05 versus untreated group). FO; fermented extract of C. gigas. DEX; dexamethasone, and UT; untreated control.

Acknowledgments
This image is the copyrighted work of the attributed author or publisher, and ZFIN has permission only to display this image to its users. Additional permissions should be obtained from the applicable author or publisher of the image. Full text @ Biomolecules