
IMAGE
Figure 7
- ID
- ZDB-IMAGE-191230-1791
- Publication
- Vicente et al., 2019 - Visualization of Mitochondrial Ca2+ Signals in Skeletal Muscle of Zebrafish Embryos with Bioluminescent Indicators
- All Figures
- Figures for Vicente et al., 2019
Image
|
Figure Caption
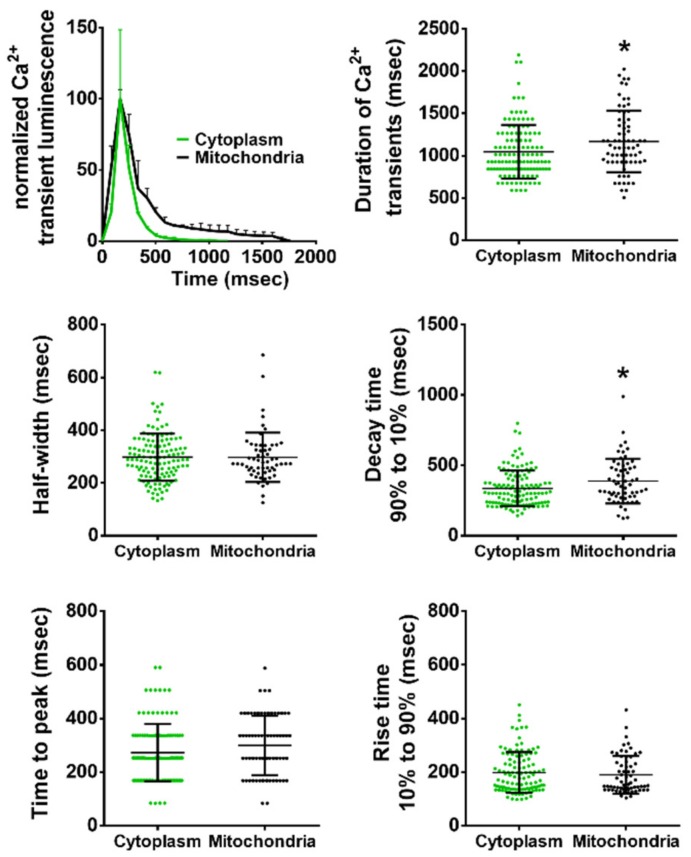
Figure 7
Comparison of the kinetic parameters of cytosolic and mitochondrial Ca2+ transients in zebrafish trunk in embryos expressing GA and mitoGA. Ca2+ transients in cytoplasm and mitochondria were compared. Embryos were imaged at 11.9 Hz. A two-tailed unpaired
Acknowledgments
This image is the copyrighted work of the attributed author or publisher, and
ZFIN has permission only to display this image to its users.
Additional permissions should be obtained from the applicable author or publisher of the image.
Full text @ Int. J. Mol. Sci.