
Figure 1—figure supplement 2
- ID
- ZDB-IMAGE-191230-1661
- Publication
- Fillatre et al., 2019 - TEADs, Yap, Taz, Vgll4s transcription factors control the establishment of Left-Right asymmetry in Zebrafish
- All Figures
- Figures for Fillatre et al., 2019
|
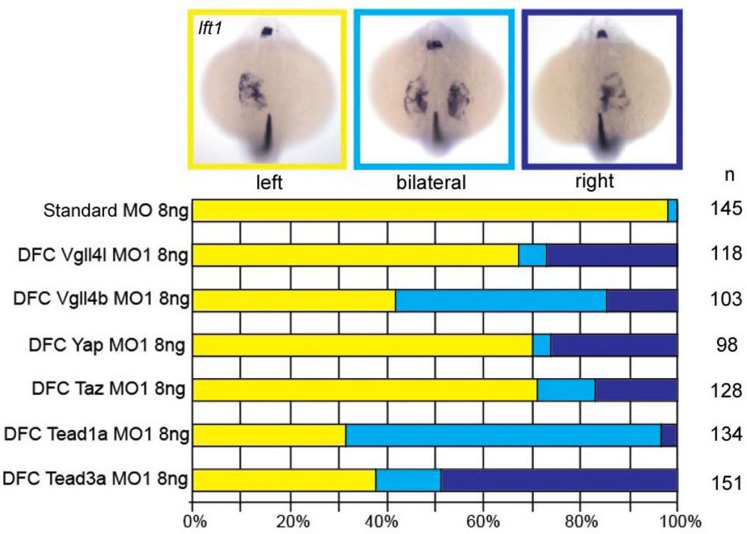
Figure 1—figure supplement 2
Graphs indicate the percentage of embryos with normal expression of