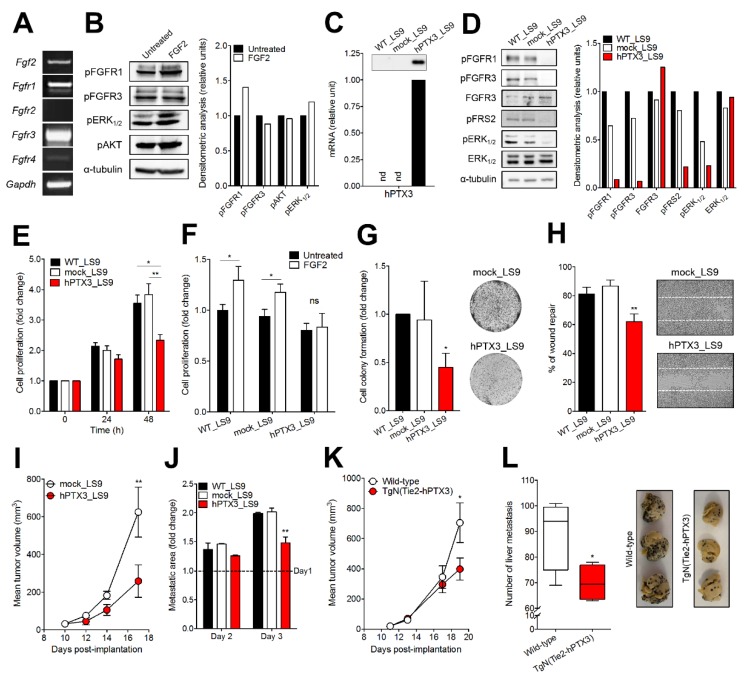
Effect of long-pentraxin 3 (PTX3) overexpression on B16-LS9 cells. (A) RT-PCR analysis of Fgf2 and Fgfr expression in B16-LS9 cells. (B) Western blot analysis of the phosphorylation of FGFR1 and FGFR3 and of the downstream signaling proteins ERK1/2 and AKT in B16-LS9 cells following 30 min treatment with 30 ng/mL FGF2. (C) RT-PCR analysis of human PTX3 (hPTX3) expression in WT_LS9, mock_LS9, and hPTX3_LS9 cells. Inset: Western blot analysis of PTX3 protein levels in the extracts of the same cells. (D) Western blot analysis of the phosphorylation of FGFR1, FGFR3, FRS2, and ERK1/2 proteins in WT_LS9, mock_LS9, and hPTX3_LS9 cell extracts. (E) WT_LS9, mock_LS9, and hPTX3_LS9 cells were seeded in 48-well plates at 104 cells/well in medium containing 0.4% FBS. After 24 h (T0), medium was changed, and cell were counted 24 and 48 h thereafter. Data are the mean ± SEM of three independent experiments in triplicate. (F) Cells were seeded as in (E). At T0, cells were treated with 30 ng/mL FGF2 and counted 24 h thereafter. Data are the mean ± SEM of three independent experiments in triplicate (G) WT_L69, mock_LS9, and hPTX3_LS9 cells were seeded at 50 cells/cm2. After 10 days, cell colonies were stained with crystal violet and quantified by computerized image analysis. Representative images of mock_LS9 and hPTX3_LS9 cell colonies are shown on the right. Data are the mean ± SEM of 15 fields for each triplicate sample. (H) A mechanical wound was performed in WT_LS9, mock_LS9, and hPTX3_LS9 cell monolayers. After 18 h, cell migration at the leading edge of the wound was quantified by computerized image analysis. Representative images of wounded mock_LS9 and hPTX3_LS9 cell monolayers are shown on the right. Data are the mean ± SEM of six microscopic fields. (I) Mock_LS9 and hPTX3_LS9 cells were injected subcutaneously (s.c.) in syngeneic mice at 50,000 cells/graft and tumor growth was measured with calipers. Data are the mean ± SEM (n = 16). (J) Red fluorescent WT_LS9, mock_LS9, and hPTX3_LS9 cells were injected into the bloodstream of 48 hours post fertilization (hpf) zebrafish embryos (80–100 cells/embryo). During the next 3 days, the growth of fluorescent metastases in the tail vascular plexus was quantified by fluorescence microscopy followed by computerized image analysis. Data are the mean ± SEM of three independent experiments (n = 20) and were normalized to metastasis areas at day 1. (K) WT_LS9 cells were injected s.c. in wild-type and transgenic TgN (Tie2-hPTX3) mice (50,000 cells/graft) and tumor growth was measured with calipers. Data are the mean ± SEM (n = 18). (L) WT_LS9 cells were injected into the spleen of wild-type and transgenic TgN (Tie2-hPTX3) mice (20,000 cells/graft). After 14 days, livers were harvested, and metastases were counted. Representative images of harvested livers are shown on the right. Data are the mean ± SEM (n = 5). In (B) and (D), the right panel shows the densitometric analysis of immunoreactive bands normalized to α-tubulin protein levels. *p < 0.05; **p < 0.01, Student’s t-test (F,L), one-way (E,H,J) and two-way (I,K) analysis of variance.
Acknowledgments
This image is the copyrighted work of the attributed author or publisher, and
ZFIN has permission only to display this image to its users.
Additional permissions should be obtained from the applicable author or publisher of the image.
Full text @ Cancers
Your Input Welcome
Thank you for submitting comments. Your input has been emailed to ZFIN curators who may contact you if
additional information is required.
Oops. Something went wrong. Please try again later.