
Figure 3
- ID
- ZDB-IMAGE-191230-1502
- Publication
- Collodet et al., 2019 - AMPK promotes induction of the tumor suppressor FLCN through activation of TFEB independently of mTOR
- All Figures
- Figures for Collodet et al., 2019
|
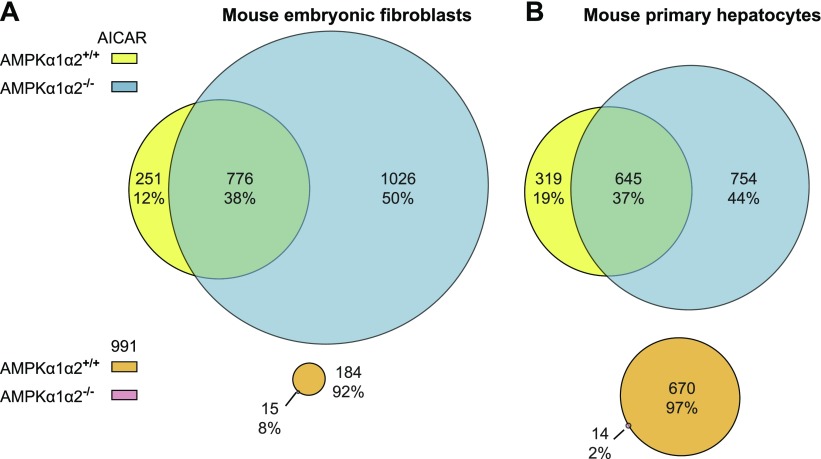
Figure 3
Transcriptome data analysis of the AMPK-activation response following treatment with 991 and AICAR. Venn diagrams showing the transcriptome profiling specificity of 991 and AICAR in MEFs (