
Figure 3
- ID
- ZDB-IMAGE-191230-1476
- Genes
- Antibodies
- Publication
- Duchemin et al., 2019 - Mechanically activated Piezo channels modulate outflow tract valve development through the Yap1 and Klf2-Notch signaling axis
- All Figures
- Figures for Duchemin et al., 2019
|
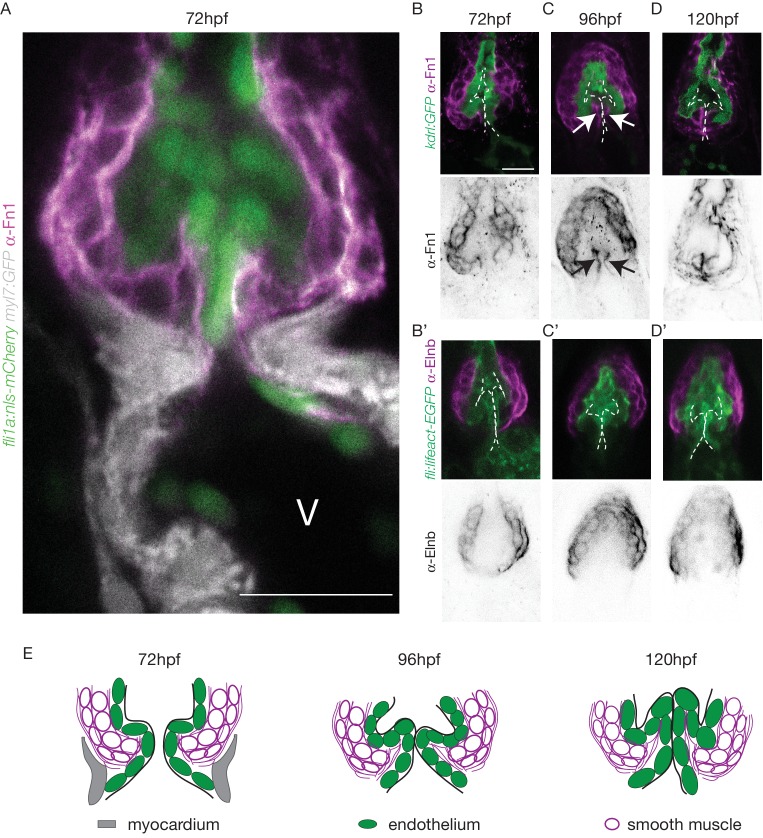
Figure 3 The OFT endothelium is surrounded by smooth muscle cell progenitors expressing fibronectin and elastin. (A) Staining of Fibronectin1 (magenta) on Tg(myl7:GFP; fli1a:nls-mCherry), highlighting the myocardium (white) and the endothelium (green) at 72 hpf. Scale bar: 20 μm. V: ventricle. Fibronectin1 (anti-Fn1, magenta) counterstaining on Tg(kdrl:GFP) and Elastinb (anti-Elnb, magenta) counterstaining on Tg(fli:lifeact-EGFP) showing their expressions in the OFT at 72 hpf (B), (B’) respectively) at 96 hpf (C), (C’) respectively) and at 120 hpf (D, D’ respectively). Scale bar: 20 µm. Arrows show the Fn1 localisation within the valve leaflets. Results obtained from three independent experiments. (E) Scheme of the three layers shown in A’, B, C and D (magenta, smooth muscles; green, endothelium; grey, myocardium; Fibronectin1, magenta lines) at 72hpf, 96hpf and 120hpf.