
|
Fig 2
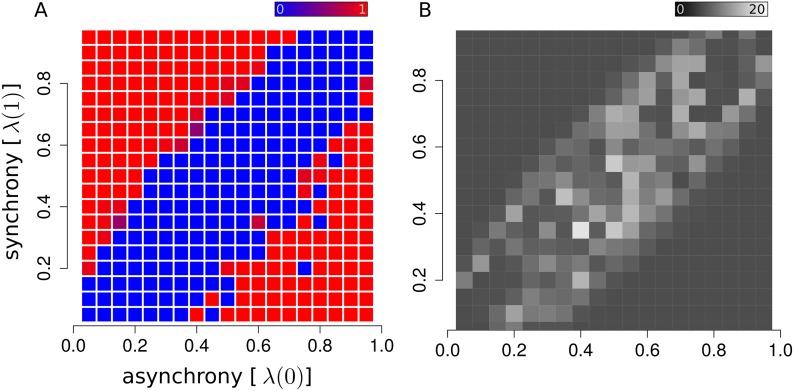
The ability to identify assemblies in a dataset depends on the model parameters. When synchrony and asynchrony levels are too similar, the recording time might not be sufficient to capture small differences in firing patterns. (A) Raster plot displaying detectable (red) versus non-detectable (blue) regimes of as a function of synchrony and asynchrony parameters of the model (we used 5 randomly generated assemblies for each configuration of synchrony and asynchrony). (B) Raster plot representing the number of neurons reassigned, on average, for every random sample of the Markov chain. The average transition rate can be viewed as an order parameter characterizing the transition between detectable and non-detectable phases.