IMAGE

Figure 2

ID
ZDB-IMAGE-191230-1326
Source
Figures for Chen et al., 2019
Image
Figure Caption

Figure 2

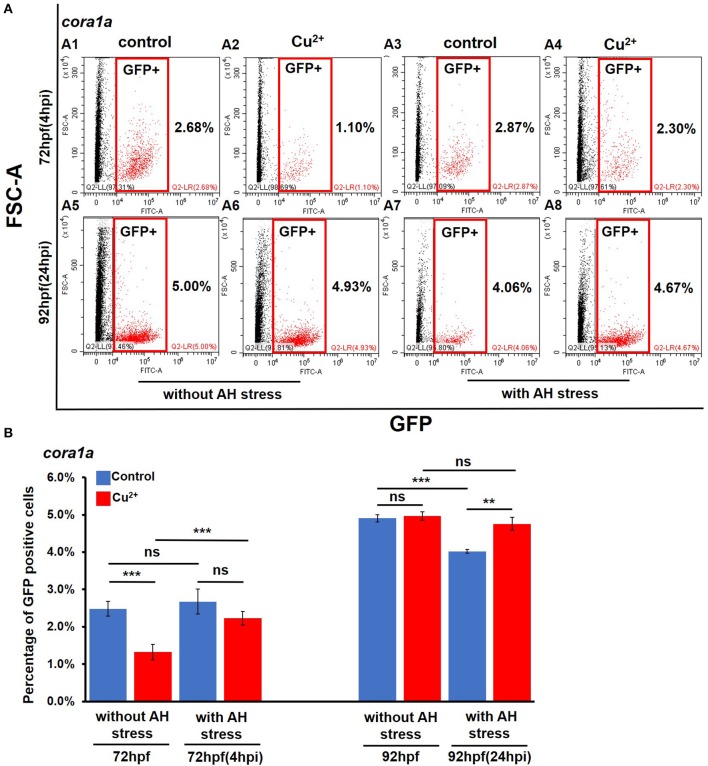
Percentages of coro1a promotor-driven GFP-positive cells in copper-stressed and the no-copper-stressed control larvae before and after A. hydrophila infection. FACS (flow cytometry) plots (A1A8) (red boxes indicating GFP-positive cells) and percentages (B) of coro1a promotor-driven GFP-positive macrophages and neutrophils in copper-stressed and control larvae with or without A. hydrophila infection. Three biological replicates were performed. ANOVA post-hoc Tukey's test. Data are presented as mean ± SD. ***P < 0.001; **P < 0.01; and ns, no significance.

Acknowledgments
This image is the copyrighted work of the attributed author or publisher, and ZFIN has permission only to display this image to its users. Additional permissions should be obtained from the applicable author or publisher of the image. Full text @ Front Immunol