
|
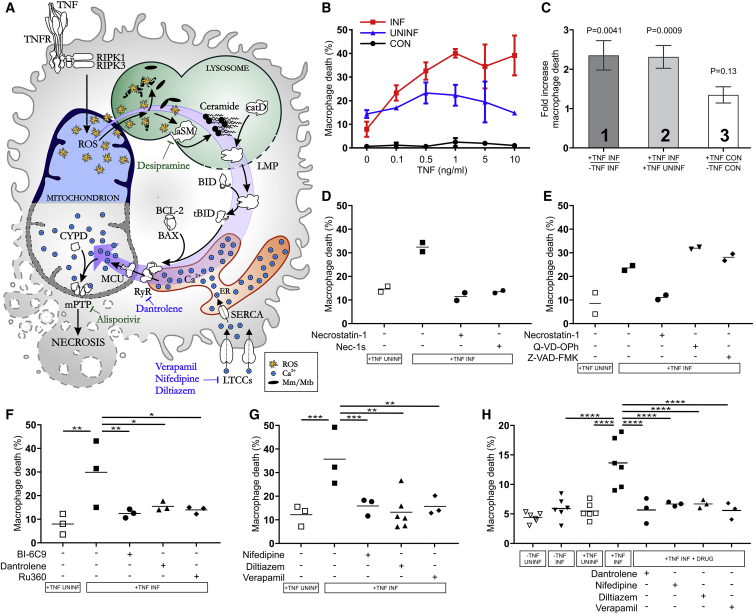
Figure 7
Mycobacterium-Infected Human Macrophages Undergo TNF-Mediated Necrosis
(A) Model of TNF-mediated macrophage necrosis pathway. LMP, lysosomal membrane permeabilization; previously identified drugs in green, drugs identified in this study in blue.
(B) THP-1 macrophage death 5 h after TNF administration (Mean ± SD). CON, macrophages from uninfected wells; INF, Mm-infected macrophages in infected wells; UNINF, uninfected macrophages in infected wells.
(C) Quantification of TNF-induced macrophage death in multiple experiments. Column 1: ratio of TNF-treated to vehicle-treated dead Mm-infected macrophages. Column 2: ratio of dead infected macrophages to dead uninfected macrophages in the same TNF-treated well. Column 3: ratio of dead macrophages in TNF-treated to vehicle-treated uninfected wells. Mean ± SEM of 12 independent experiments for columns 1 and 2, and 11 independent experiments for column 3; one sample t test to a hypothetical value of 1, corresponding to the null hypothesis that TNF and infection do not influence cell death.
(D) Percentage of dead Mm-infected macrophages after TNF administration treated with necrostatin-1 or Nec-1 s. Horizontal bars, means. Representative of 3 independent experiments.
(E) Percentage of dead Mm-infected macrophages after TNF administration treated with necrostatin-1, Q-VD-OPh, or Z-VAD-FMK. Horizontal bars, means. Representative of 3 (necrostatin-1 and Z-VAD-FMK) or 2 (Q-VD-OPh) independent experiments.
(F and G) Percentage of dead Mm-infected macrophages after TNF administration treated with BI-6C9, dantrolene, Ru360 (F), and diltiazem, nifedipine, or verapamil (G). Horizontal bars, means; ∗p < 0.05; ∗∗p < 0.01; ∗∗∗p < 0.001 (one-way ANOVA with Bonferroni’s post-test for comparisons shown).
(H) Percentage of dead Mtb-infected macrophages after TNF administration treated with dantrolene, diltiazem, nifedipine, or verapamil. Horizontal bars, means; ∗∗∗∗p < 0.0001 (one-way ANOVA with Bonferroni’s post-test for comparisons shown).
See also
Reprinted from Cell, 178(6), Roca, F.J., Whitworth, L.J., Redmond, S., Jones, A.A., Ramakrishnan, L., TNF Induces Pathogenic Programmed Macrophage Necrosis in Tuberculosis through a Mitochondrial-Lysosomal-Endoplasmic Reticulum Circuit, 1344-1361.e11, Copyright (2019) with permission from Elsevier. Full text @ Cell