
|
Figure 5
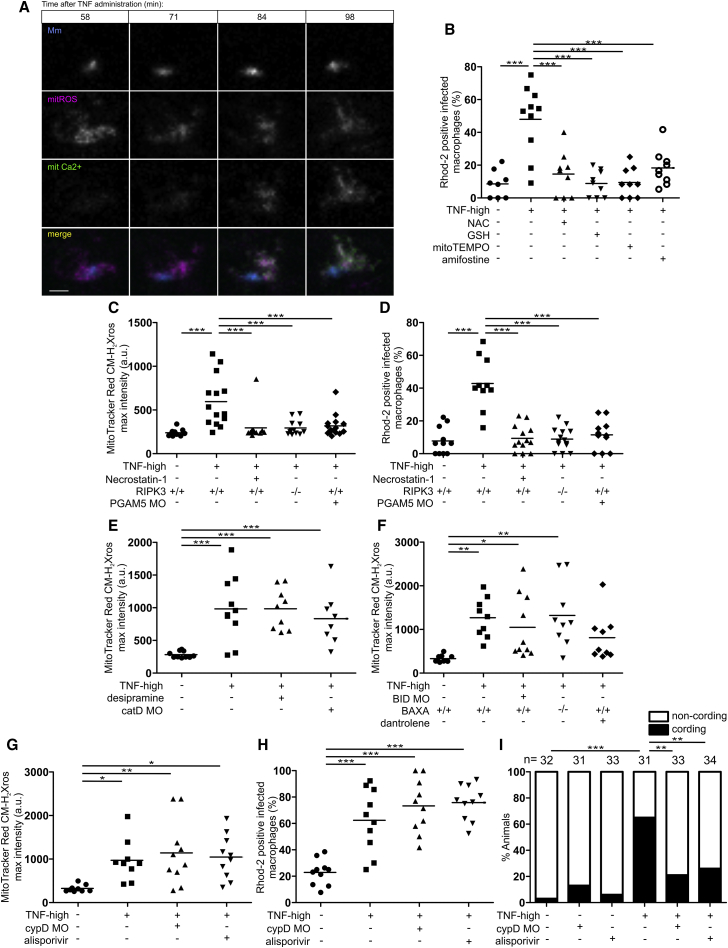
Mitochondrial ROS Launch the Pathogenic Mitochondrial-Lysosomal-ER Circuit that Leads to Mitochondrial Ca2+ Overload and Macrophage Necrosis
(A) Time-lapse confocal images of an infected macrophage in a 1 dpi mitGCaMP3 larva at indicated time points after TNF administration with MitoTracker Red CM-H2Xros. Scale bar, 5 μm.
(B) Percentage of Rhod-2-positive macrophages in 1 dpi control and TNF-high larvae treated with NAC, GSH, MitoTEMPO, or amifostine. Horizontal bars, means; ∗∗∗p < 0.001 (one-way ANOVA with Tukey’s post-test).
(C) Quantification of mitochondrial ROS production in 1 dpi TNF-high or control larvae that are WT, WT treated with necrostatin-1, PGAM5 morphant, or RIPK3 mutant. Horizontal bars, means; ∗∗∗p < 0.001 (one-way ANOVA with Tukey’s post-test).
(D) Percentage of Rhod-2-positive macrophages in 1 dpi control and TNF-high larvae control, that are WT, WT treated with necrostatin-1, PGAM5 morphant, or RIPK3 mutant. Horizontal bars, means; ∗∗∗p < 0.001 (one-way ANOVA with Tukey’s post-test).
(E) Quantification of mitochondrial ROS production in 1 dpi TNF-high or control larvae that are WT, WT treated with desipramine, or cathepsin D morphant. Horizontal bars, means; ∗∗∗p < 0.001 (one-way ANOVA with Tukey’s post-test).
(F) Quantification of mitochondrial ROS production in 1 dpi TNF-high or control larvae that are WT, WT treated with dantrolene, BID morphant, or BAX mutant. Horizontal bars, means; ∗p < 0.05; ∗∗p < 0.01 (one-way ANOVA with Tukey’s post-test).
(G) Quantification of mitochondrial ROS production in 1 dpi TNF-high or control larvae that are WT, WT treated with alisporivir, or cyclophilin D morphant. Horizontal bars, means; ∗p < 0.05; ∗∗p < 0.01 (one-way ANOVA with Tukey’s post-test).
(H) Percentage of Rhod-2-positive macrophages in 1 dpi TNF-high or control larvae that are WT, WT treated with alisporivir, or cyclophilin D morphant. Horizontal bars, means; ∗∗∗p < 0.001 (Fisher’s exact test).
(I) Cording in 5 dpi TNF-high or control larvae that are WT, WT treated with alisporivir, or cyclophilin D morphant. ∗∗p < 0.01; ∗∗∗p < 0.001 (Fisher’s exact test).
See also
Reprinted from Cell, 178(6), Roca, F.J., Whitworth, L.J., Redmond, S., Jones, A.A., Ramakrishnan, L., TNF Induces Pathogenic Programmed Macrophage Necrosis in Tuberculosis through a Mitochondrial-Lysosomal-Endoplasmic Reticulum Circuit, 1344-1361.e11, Copyright (2019) with permission from Elsevier. Full text @ Cell