
|
Figure 2
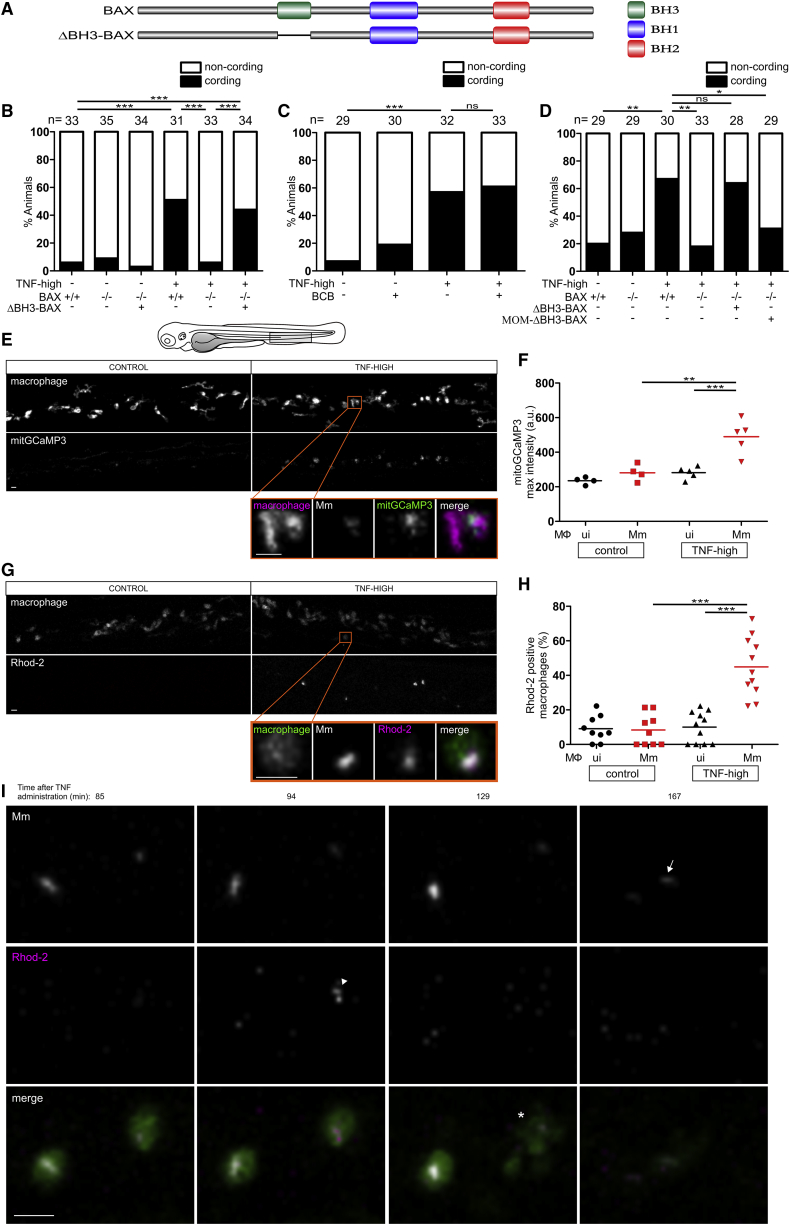
BAX Mediates Macrophage Necrosis by Promoting Mitochondrial Ca2+ Overload Independent of BH3-Dependent Oligomerization and Interaction with the Mitochondrial Outer Membrane
(A) Schematic of BAX to show BH domains.
(B) Cording in 5 dpi TNF-high and control larvae that are WT, BAX mutant, or BAX mutant expressing ΔBH3-BAX. ∗∗∗p < 0.001 (Fisher’s exact test). Representative of 6 independent experiments.
(C) Cording in 5 dpi TNF-high and control larvae treated with BAX channel blocker (BCB). ∗∗∗p < 0.001 (Fisher’s exact test). Representative of 3 independent experiments.
(D) Cording in 5 dpi TNF-high and control larvae that are WT, BAX mutant, BAX mutant expressing ΔBH3-BAX, or BAX mutant expressing ΔBH3-BAX targeted to the mitochondrial outer membrane (MOM-ΔBH3-BAX). ∗p < 0.05; ∗∗p < 0.01 (Fisher’s exact test). Representative of 2 independent experiments.
(E) Representative confocal images of 1 dpi TNF-high (90 min post-TNF treatment) or control larvae, both expressing mitGCaMP3 (GCaMP3 targeted to the mitochondria) in their macrophages, which are red fluorescent. Area shown corresponds to area in the shaded rectangle in the cartoon above. Detailed image of orange rectangle in TNF-high larva additionally shows the bacteria within a mitGCaMP3-expressing macrophage. Scale bars, 10 μm.
(F) Quantitation of mitGCaMP3 fluorescence in individual macrophages from larvae in (A). Black and red symbols represent uninfected (ui) and Mm-infected macrophages, respectively, in the same control or TNF-treated animal. Horizontal bars, means; ∗∗∗p < 0.001 (one-way ANOVA with Tukey’s post-test). Representative of 2 independent experiments.
(G) Representative confocal images of 1 dpi TNF-high (120 min post-TNF treatment) or control larvae with yellow fluorescent macrophages showing Rhod-2 fluorescence (red). Area shown similar to (A). Detail: macrophage in the orange rectangle. Scale bar, 10 μm.
(H) Percentage of uninfected or Mm-infected macrophages with Rhod-2 fluorescence from TNF-high larvae in (C). Black and red symbols represent uninfected and Mm-infected macrophages, respectively, in the same control or TNF-treated animal. Horizontal bars, means; ∗∗∗p < 0.001 (one-way ANOVA with Tukey’s post-test). Representative of 2 independent experiments.
(I) Time-lapse confocal images of two infected macrophages in a 1 dpi larva at indicated time points after TNF administration. Arrowhead, Rhod-2 positive macrophage; asterisk, dead macrophage; arrow, extracellular bacteria. Scale bar, 10 μm.
See also
Reprinted from Cell, 178(6), Roca, F.J., Whitworth, L.J., Redmond, S., Jones, A.A., Ramakrishnan, L., TNF Induces Pathogenic Programmed Macrophage Necrosis in Tuberculosis through a Mitochondrial-Lysosomal-Endoplasmic Reticulum Circuit, 1344-1361.e11, Copyright (2019) with permission from Elsevier. Full text @ Cell