
Figure 1
- ID
- ZDB-IMAGE-191230-1251
- Publication
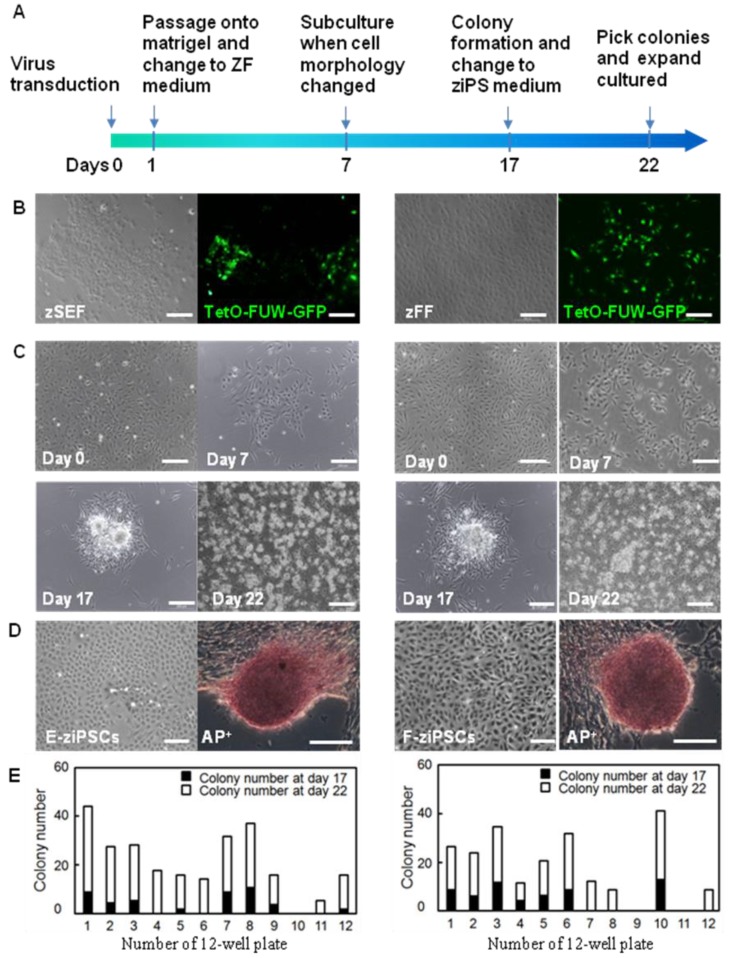
- Peng et al., 2019 - Generation of Stable Induced Pluripotent Stem-like Cells from Adult Zebra Fish Fibroblasts
- All Figures
- Figures for Peng et al., 2019
|
Figure 1