IMAGE

Figure 5.

ID
ZDB-IMAGE-191230-1216
Source
Figures for Ge et al., 2019
Image
Figure Caption

Figure 5.

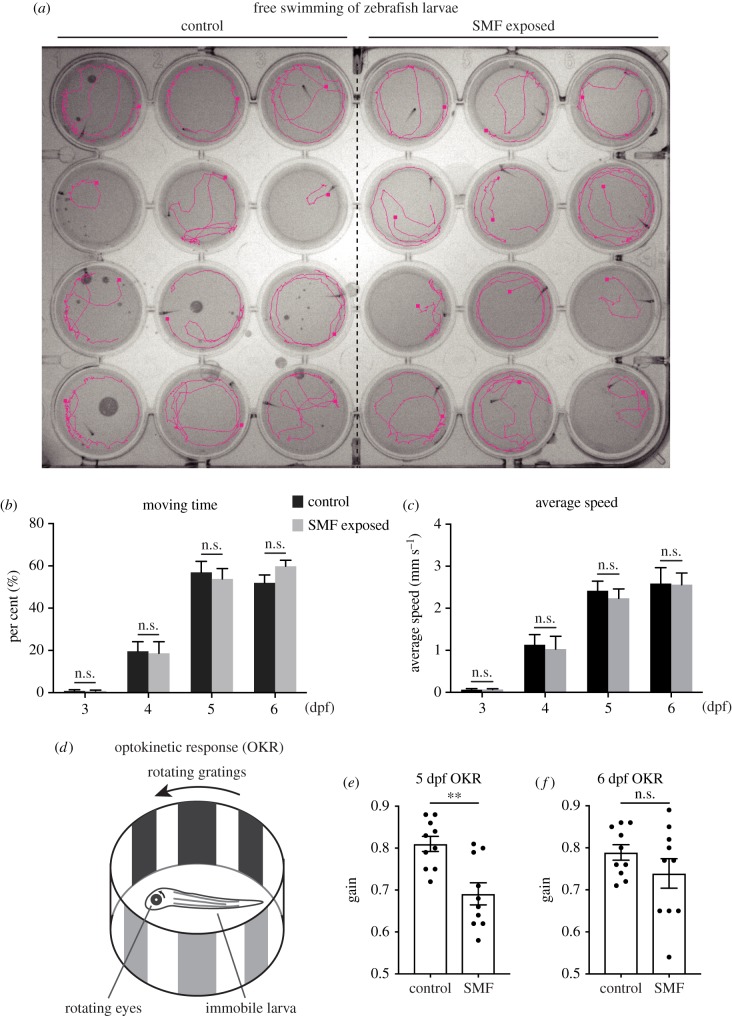
Behavioural tests of the effects of strong SMF. (a) The magenta line portrayed the swimming path of zebrafish larvae in 1 min. Experiments were performed in a 24-hole dish, with one larva to each hole. (b) Moving time of larvae in free swimming tests. (c) Average speed of larvae in free swimming tests. (d) Schematic depiction of OKR tests. (e,f) Performance of larvae in OKR tests at 5 and 6 dpf, respectively. Each data point came from 24 larvae in (b,c). Data were analysed with multiple t-tests and the p-values are (b) 0.96, 0.90, 0.67, 0.10; (c) 0.91, 0.79, 0.57, 0.96. (e) and (f) used 10 larvae in each group. Data were analysed with t-test and the p-values are (e) 0.002 and (f) 0.22. All data are shown as mean with s.e.m. *p < 0.05, **p < 0.01, ***p < 0.001, n.s., no significance.

Acknowledgments
This image is the copyrighted work of the attributed author or publisher, and ZFIN has permission only to display this image to its users. Additional permissions should be obtained from the applicable author or publisher of the image. Full text @ Open Biol.