IMAGE

Figure 4.

ID
ZDB-IMAGE-191230-1215
Source
Figures for Ge et al., 2019
Image
Figure Caption

Figure 4.

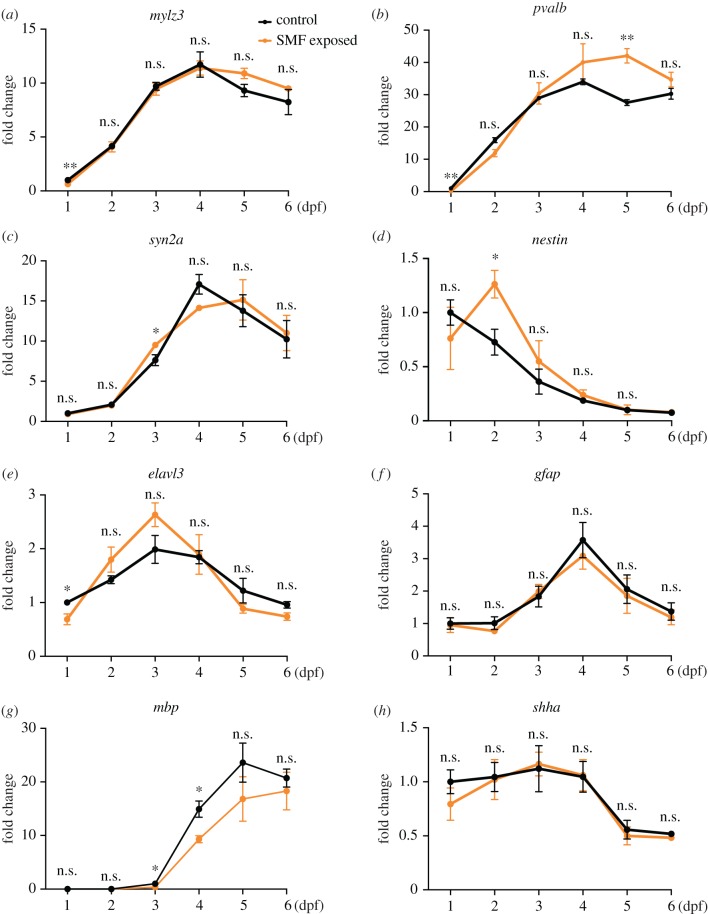
qRT–PCR analysis of eight indicator genes from 1 to 6 dpf. Each data point came from three samples, with 30 embryos each at 1 and 2 dpf, and 15 embryos each at 3–6 dpf. Results were analysed with multiple t-tests and the p-values in each figure, from left to right, are (a) 0.008, 0.90, 0.71, 0.82, 0.10, 0.35; (b) 0.002, 0.04, 0.68, 0.36, 0.004, 0.19; (c) 0.63, 0.74, 0.05, 0.08, 0.69, 0.82; (d) 0.49, 0.04, 0.45, 0.36, 0.95, 0.79; (e) 0.04, 0.20, 0.13, 0.90, 0.24, 0.08; (f) 0.88, 0.30, 0.70, 0.52, 0.78, 0.63; (g) 0.49, 0.62, 0.04, 0.03, 0.29, 0.57; and (h) 0.33, 0.93, 0.87, 0.94, 0.66, 0.11. Data were normalized and shown as mean with s.e.m. *p < 0.05, **p < 0.01, ***p < 0.001, n.s., no significance.

Acknowledgments
This image is the copyrighted work of the attributed author or publisher, and ZFIN has permission only to display this image to its users. Additional permissions should be obtained from the applicable author or publisher of the image. Full text @ Open Biol.