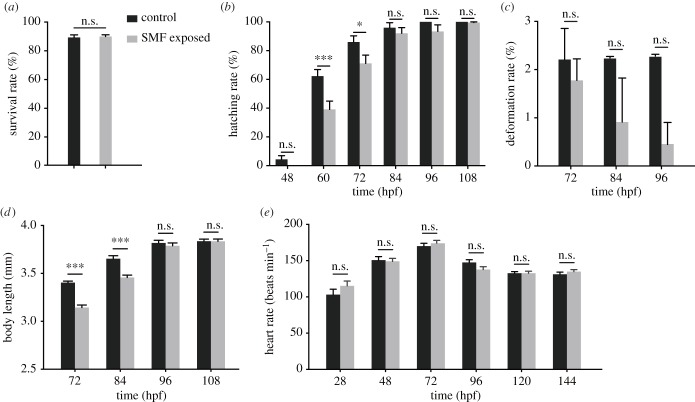
IMAGE

Figure 2.

ID
ZDB-IMAGE-191230-1213
Source
Figures for Ge et al., 2019
Image
Figure Caption

Figure 2.

Developmental indices of zebrafish. (a) Survival rate of embryos with or without 24 h SMF exposure, calculated when embryos were fetched out from SMF. Data came from three samples with 50 embryos each (p = 0.77). (b) Hatching rate from 2 to 4.5 dpf, calculated every 0.5 day. Control data came from three samples with 91 embryos each, and SMF-exposed data were from three samples with 75 embryos each. From left to right, the p-value is 0.41, less than 0.001, 0.009, 0.46, 0.22 and 0.93. (c) Deformation rate calculated after most embryos had hatching. Data source was the same as b. From left to right, the p-value is 0.57, 0.10 and 0.03. (d) Body length measured with ImageJ. Data were collected from 30 samples. From left to right, the p-value is less than 0.001, less than 0.001, 0.43 and 0.99. (e) Heart rate from 1 to 6 dpf. Each data point came from 12 embryos. From left to right, the p-value is 0.06, 0.79, 0.52, 0.11, greater than 0.99, 0.54. Data are shown as mean with s.e.m. *p < 0.05, **p < 0.01, ***p < 0.001, n.s., no significance.

Acknowledgments
This image is the copyrighted work of the attributed author or publisher, and ZFIN has permission only to display this image to its users. Additional permissions should be obtained from the applicable author or publisher of the image. Full text @ Open Biol.