IMAGE

FIGURE 5

ID
ZDB-IMAGE-191230-1200
Source
Figures for Arribat et al., 2019
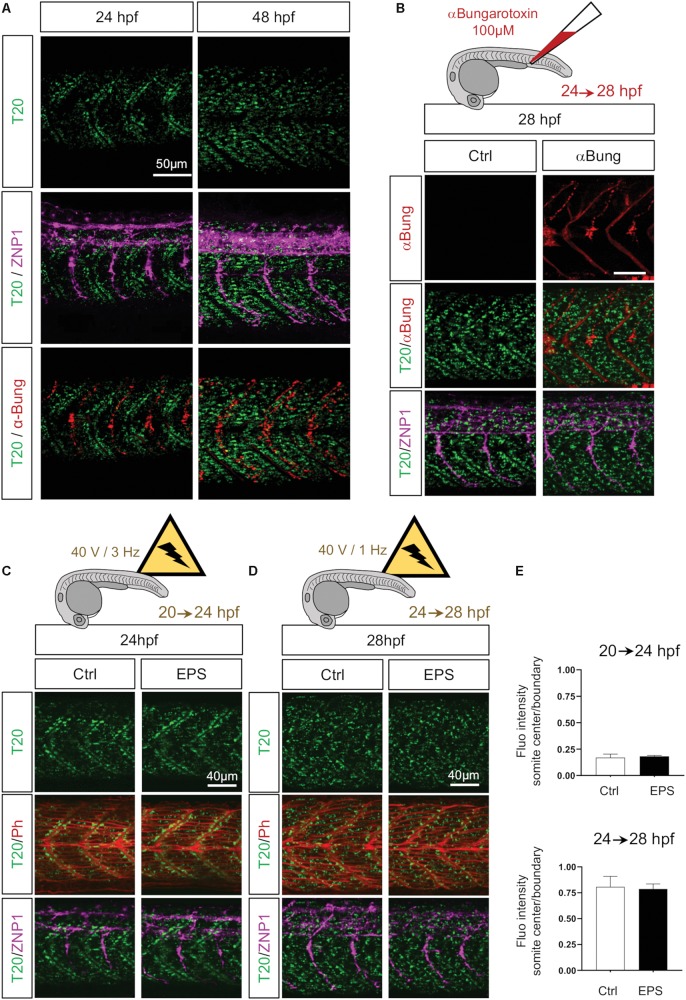
Image
Figure Caption

FIGURE 5

Neuronal stimulation and muscle contractions do not mediate mitochondrial patterning. (A) Confocal imaging of mitochondrial network (Tomm20, T20; green) counterstained with a marker for neuromuscular junctions αBungarotoxin (αBung; red) and a marker for primary motor neurons (ZNP1; magenta) at 24 and 48 hpf. While T20 signal corresponds to a unique confocal stack, αBung and ZNP1 represent the Z project. (B) Confocal imaging of mitochondrial network (Tomm20, T20; green) counterstained with αBungarotoxin (αBung; red) and primary motor neurons (ZNP1; magenta) at 28 hpf, with or without intravenous injection of αBungarotoxin performed at 24 hpf. (C) Confocal imaging of mitochondrial network (Tomm20, T20; green) counterstained with Phalloidin (Ph; red) at 24 hpf, with or without electrical pulse stimulation (EPS) applied at 20 hpf. (D) Confocal imaging of mitochondrial network (Tomm20, T20; green) counterstained with Phalloidin (Phall; red) at 28 hpf, with or without electrical pulse stimulation (EPS) applied at 24 hpf. (E) Quantification of Tomm20-zsGreen fluorescence ratio between somite center and boundary region at 24 and 28 hpf after 4 h of EPS (n = 6 fish per group, 3 images analyzed per fish).

Acknowledgments
This image is the copyrighted work of the attributed author or publisher, and ZFIN has permission only to display this image to its users. Additional permissions should be obtained from the applicable author or publisher of the image. Full text @ Front Cell Dev Biol