
Fig. S5
- ID
- ZDB-IMAGE-191118-11
- Publication
- Ando et al., 2019 - Peri-arterial specification of vascular mural cells from naïve mesenchyme requires Notch signaling
- All Figures
- Figures for Ando et al., 2019
|
Fig. S5
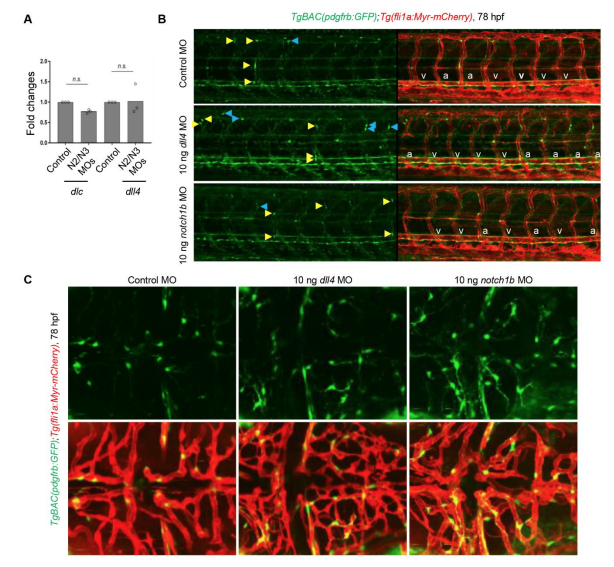
Effects of notch2/3, dll4, or notch1b depletion. (A) qPCR analysis of dlc and dll4 expression in whole 72 hpf larvae injected with 5 ng each of notch2 and notch3 MOs (N2/N3 MOs). (B) Confocal stack images of trunk vessels in the 78 hpf TgBAC(pdgfrb:GFP);Tg(fli1a:Myr-mCherry) larvae injected with control MO, 10 ng dll4, or 10 ng notch1b MO. a, aISV. v, vISV. Yellow or blue arrowheads, pdghrbhigh MCs in aISV or vISV, respectively. (C) Dorsal view of confocal stack images of brain vessels (mainly CtAs) in the 78 hpf TgBAC(pdgfrb:GFP);Tg(fli1a:Myr-mCherry) larvae injected with control MO, 10 ng dll4, or 10 ng notch1b MO.