
|
Fig. 7
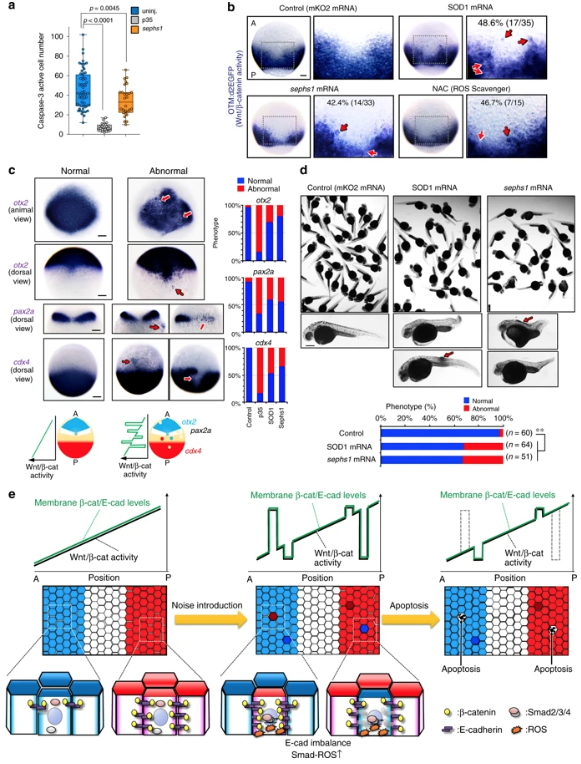
Apoptotic elimination of unfit cells is required for precise tissue patterning. a Sephs1 overexpression partially reduces physiologically occurring apoptosis in embryos as determined by caspase-3 immunostaining. Box plots of caspase-3-active cell number per embryo at 10 hpf stage show 75th, 50th (median) and 25th percentiles. Whiskers indicate minimum and maximum. Each dot represents one embryo ( n = 28 embryos, two independent experiments). **** p < 0.0001, ** p < 0.045 (one-way ANOVA). bInhibiting ROS production distorts the Wnt/β-catenin-gradient. Whole-mount in situ hybridization of d2EGFP in Tg(OTM:d2EGFP) embryos (dorsal view) injected with mKO2 (control), SOD1, or sephs1 mRNA (800 pg) or treated with 100 μM NAC. Magnification of boxed area (black line) (right). Embryo percentages and numbers with similar expression patterns are shown. Red arrows: ectopic activation or inactivation areas. Scale bar, 200 μm. p < 0.05 for NAC treatment versus control; p < 0.01 for SOD1 or sephs1 mRNA versus control (Fisher’s exact test). c Inhibition of ROS-mediated apoptosis distorts AP patterning. Panels show whole-mount in situ hybridization of otx2(marker of presumptive forebrain and midbrain), pax2a (marker of presumptive midbrain-hindbrain boundary), and cdx4 (marker of presumptive spinal cord) in embryos uninjected or injected with mKO2(control), p35, sephs1, or SOD1 mRNA (800 pg). Scale bar, 200 μm. Bottom schematic illustration indicates expression pattern of AP tissue markers. Right graphs show percentages of embryos with normal or abnormal expression patterns. In abnormal embryos, a posterior marker ( cdx4) and anterior markers ( pax2a and otx2) are ectopically activated in the anterior and posterior areas, respectively. d Overexpression of SOD1 or sephs1 mRNA induces abnormal morphogenesis. Images show 32 hpf zebrafish larvae uninjected or injected with SOD1 or sephs1 mRNA (800 pg). Red arrow indicates abnormal cell proliferation. Scale bar, 500 μm. Percentages of embryos with normal or abnormal morphology are shown. The numbers shown above the graph indicate the total numbers of embryos analysed. ** p < 0.01 (Fisher’s exact test). Note that a portion of embryos showed the anteriorization-related phenotype (e.g. short trunk and tail) or posteriorization-related phenotype (e.g. head- and eye-size reduction). A small number of embryos generated a tumour-like cell mass (arrows). eSchematic diagram of the Wnt/β-catenin-noise cancelling system. See also Supplementary Fig. 7