
Fig. 3
- ID
- ZDB-IMAGE-191031-4
- Publication
- Prummel et al., 2019 - A conserved regulatory program initiates lateral plate mesoderm emergence across chordates
- All Figures
- Figures for Prummel et al., 2019
|
Fig. 3
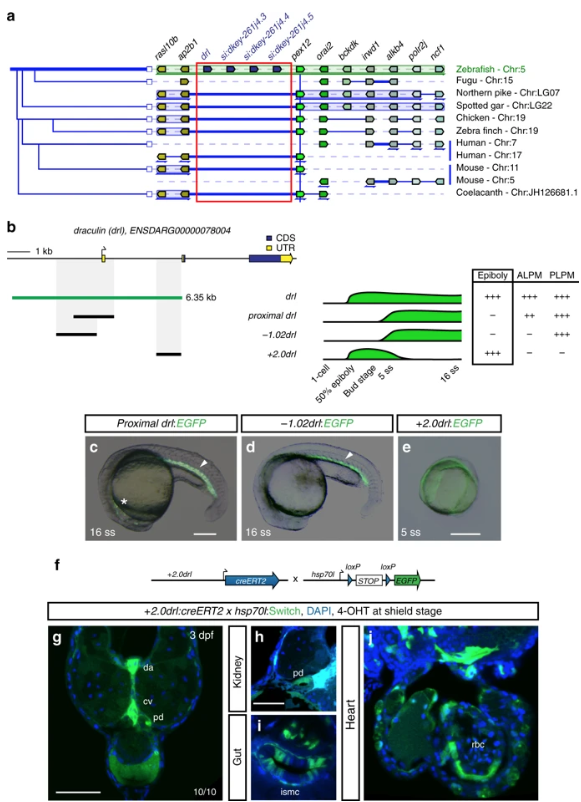
The 6.35 kb drl cis-regulatory region contains an early pan-LPM enhancer. aAdapted Genomicus-based PhyloView representation of the zebrafish drllocus (top row) compared to other vertebrate species. The view is centered on pex12 (light green, blue vertical line) as anchor, with its orthologous copies across species and corresponding neighboring loci shown by their relative positions. Genes with identical coloration are homologs/orthologs. Blue arrows below gene loci indicate switched local orientation. The phylogenetic relationship tree is depicted on the left. The red box marks the drl locus with its neighboring three drl-related genes (blue) in between ap2b1and pex12 in zebrafish as unique feature. Note the absence of any genes between ap2b1 and pex12 orthologs across fishes and other vertebrates, and conservation of suggested ancestral synteny of ap2b1 and pex12. b Schematic of the drl locus depicting the 6.35 kb cis-regulatory region (green), and smaller isolated candidate fragments proximal drl (region surrounding first exon), −1.02drl (upstream region only), and + 2.0drl (distal first intron) with specific reporter activity. Time line and table indicates expression dynamics (50% epiboly to 16 ss) of stable transgenes for the individual regulatory elements and expression domains (pan-LPM early or somite-stage ALPM, PLPM) with absent expression (-) to strong expression (+ +). c– eRepresentative stable transgenic zebrafish embryos harboring EGFP reporters for proximal drl, −1.02drl, and + 2.0drl; at 5 ss and 16 ss proximal drland −1.02drl express in PLPM (arrowheads in c, d), proximal drl additionally in ALPM (asterisk in c); note pan-LPM activity of + 2.0drl ( e). f Schematic of + 2.0drl:creERT2 to hsp70l:Switch cross for genetic lineage tracing. g– jTransverse sections at 3 dpf of + 2.0drl:creERT2 lineage tracing after 4-OHT induction at shield stage results in specific labeling of LPM-derived tissue including red blood cells (rbc), dorsal aorta (da) and cardinal vein (cv) endothelium, pronephric duct (pd), and intestinal smooth muscle cells (ismc) ( n = 10/10). + 2.0drl:creERT2 also traces endoderm-derived tissue, shown for gut epithelium. Nuclei counterstained with DAPI (blue). Scale bars ( c, e, g) 250 µm and ( h) 50 µm