
Fig. S1
- ID
- ZDB-IMAGE-191018-3
- Publication
- Espenschied et al., 2019 - Epithelial delamination is protective during pharmaceutical-induced enteropathy
- All Figures
- Figures for Espenschied et al., 2019
|
Fig. S1
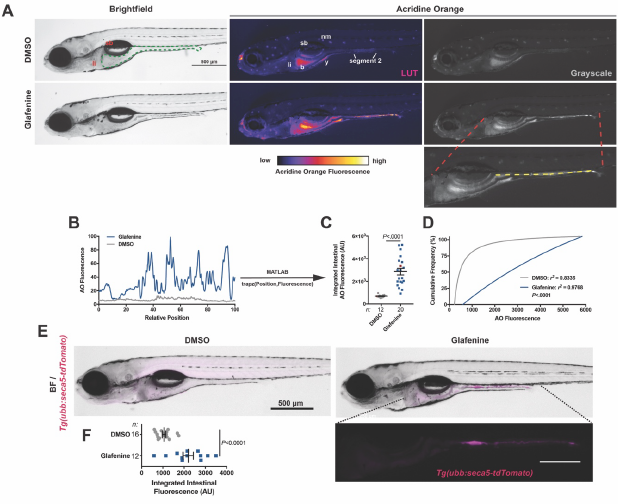
Quantification of Acridine Orange stained lumenal material and response of Tg(ubb:seca5-tdTomato) larvae to Glafenine exposure.
(A) Brightfield and fluorescence images (range indicator lookup table and grayscale) of DMSO and Glafenine treated larvae from a representative experiment (li =liver; sb = swim bladder; b = intestinal bulb; y = yolk; nm = neuromast).
(B) Representative AO line scan fluorescence traces for larvae shown in (A).
(C) Scatter dot plot of integrated intestinal AO from the same experiment in a [the points colored red correspond to the larvae shown in (A)]. Significance determined by unpaired two-sided Student’s t-test.
(D) Cumulative frequency distribution plot of data from (C) fit with 3-parameter least squares regression (significance was determined by extra-sum-of-squares F-test, rejecting the null hypothesis that one curve would fit both datasets).
(E,F) Images of Tg(ubb:seca5-tdTomato)xt24 DMSO- and Glafenine-treated 6 dpf larvae and quantification (each dot corresponds to an individual larva). Significance was determined by unpaired two-sided Student’s t-test.