
|
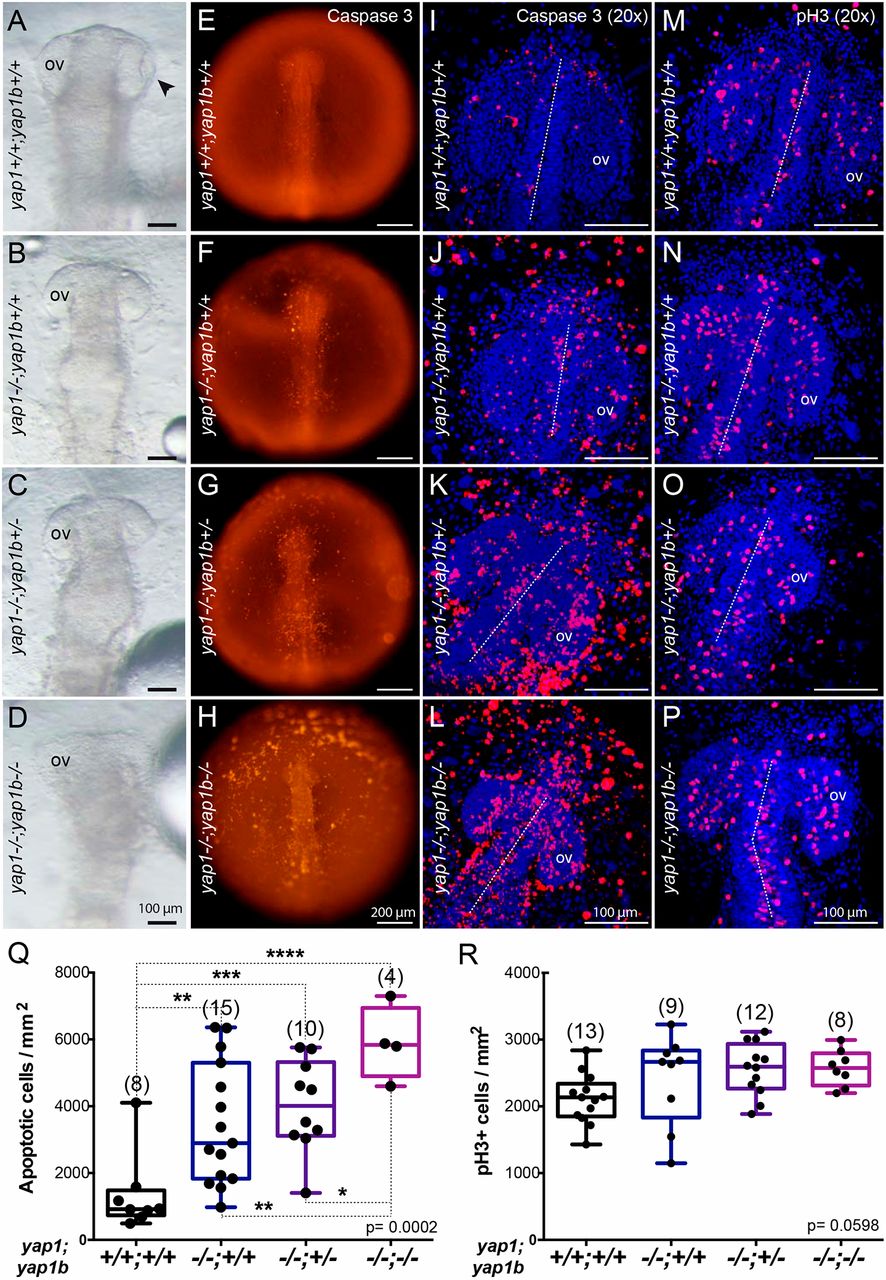
Fig. 6
yap1 and yap1b cooperate in regulating cell survival and tissue morphogenesis. Bright-field images of the anterior half of yap1+/+;yap1b+/+ (A), yap1−/−;yap1b+/+ (B), yap1−/−;yap1b+/− (C) and yap1−/−;yap1b−/− (D) stage 21 embryos from a double heterozygous cross showing negative epistatic interaction between yap1 and yap1b. yap1−/− enhanced malformations in yap1−/−;yap1b−/− double mutants (D). Caspase 3 staining reveals apoptotic cells in stage 20 yap1+/+;yap1b+/+ (E,I), yap1−/−;yap1b+/+ (F,J), yap1−/−;yap1b+/− (G,K) and yap1−/−;yap1b−/−embryos (H,L). Whole embryos are shown under the fluorescent stereo microscope (E-H). DAPI counterstained confocal images show individual apoptotic cells (I-L). DAPI counterstained confocal images of pH3-positive mitotic cells in stage 20 yap1+/+;yap1b+/+ (M), yap1−/−;yap1b+/+(N), yap1−/−;yap1b+/− (O) and yap1−/−;yap1b−/− embryos (P). Quantification of caspase 3-positive cells per area shows a significantly increased apoptosis with fewer functional copies available of the Yap paralogs (Q). Quantification of pH3-positive cells per area shows not significant differences in mutants for the Yap paralogs (R). Boxes represent the quartiles; the whiskers indicate the the maximum and minimum values. One-way ANOVA analysis followed by Fisher's LSD test was used to evaluate statistical significance. ov, optic vesicle. ****P<0.0001; ***P<0.001; **P<0.01; *P<0.05.