
IMAGE
Fig. S7
- ID
- ZDB-IMAGE-190923-17
- Publication
- Chambers et al., 2019 - Tfap2a is a novel gatekeeper of nephron differentiation during kidney development
- All Figures
- Figures for Chambers et al., 2019
Image
|
Figure Caption
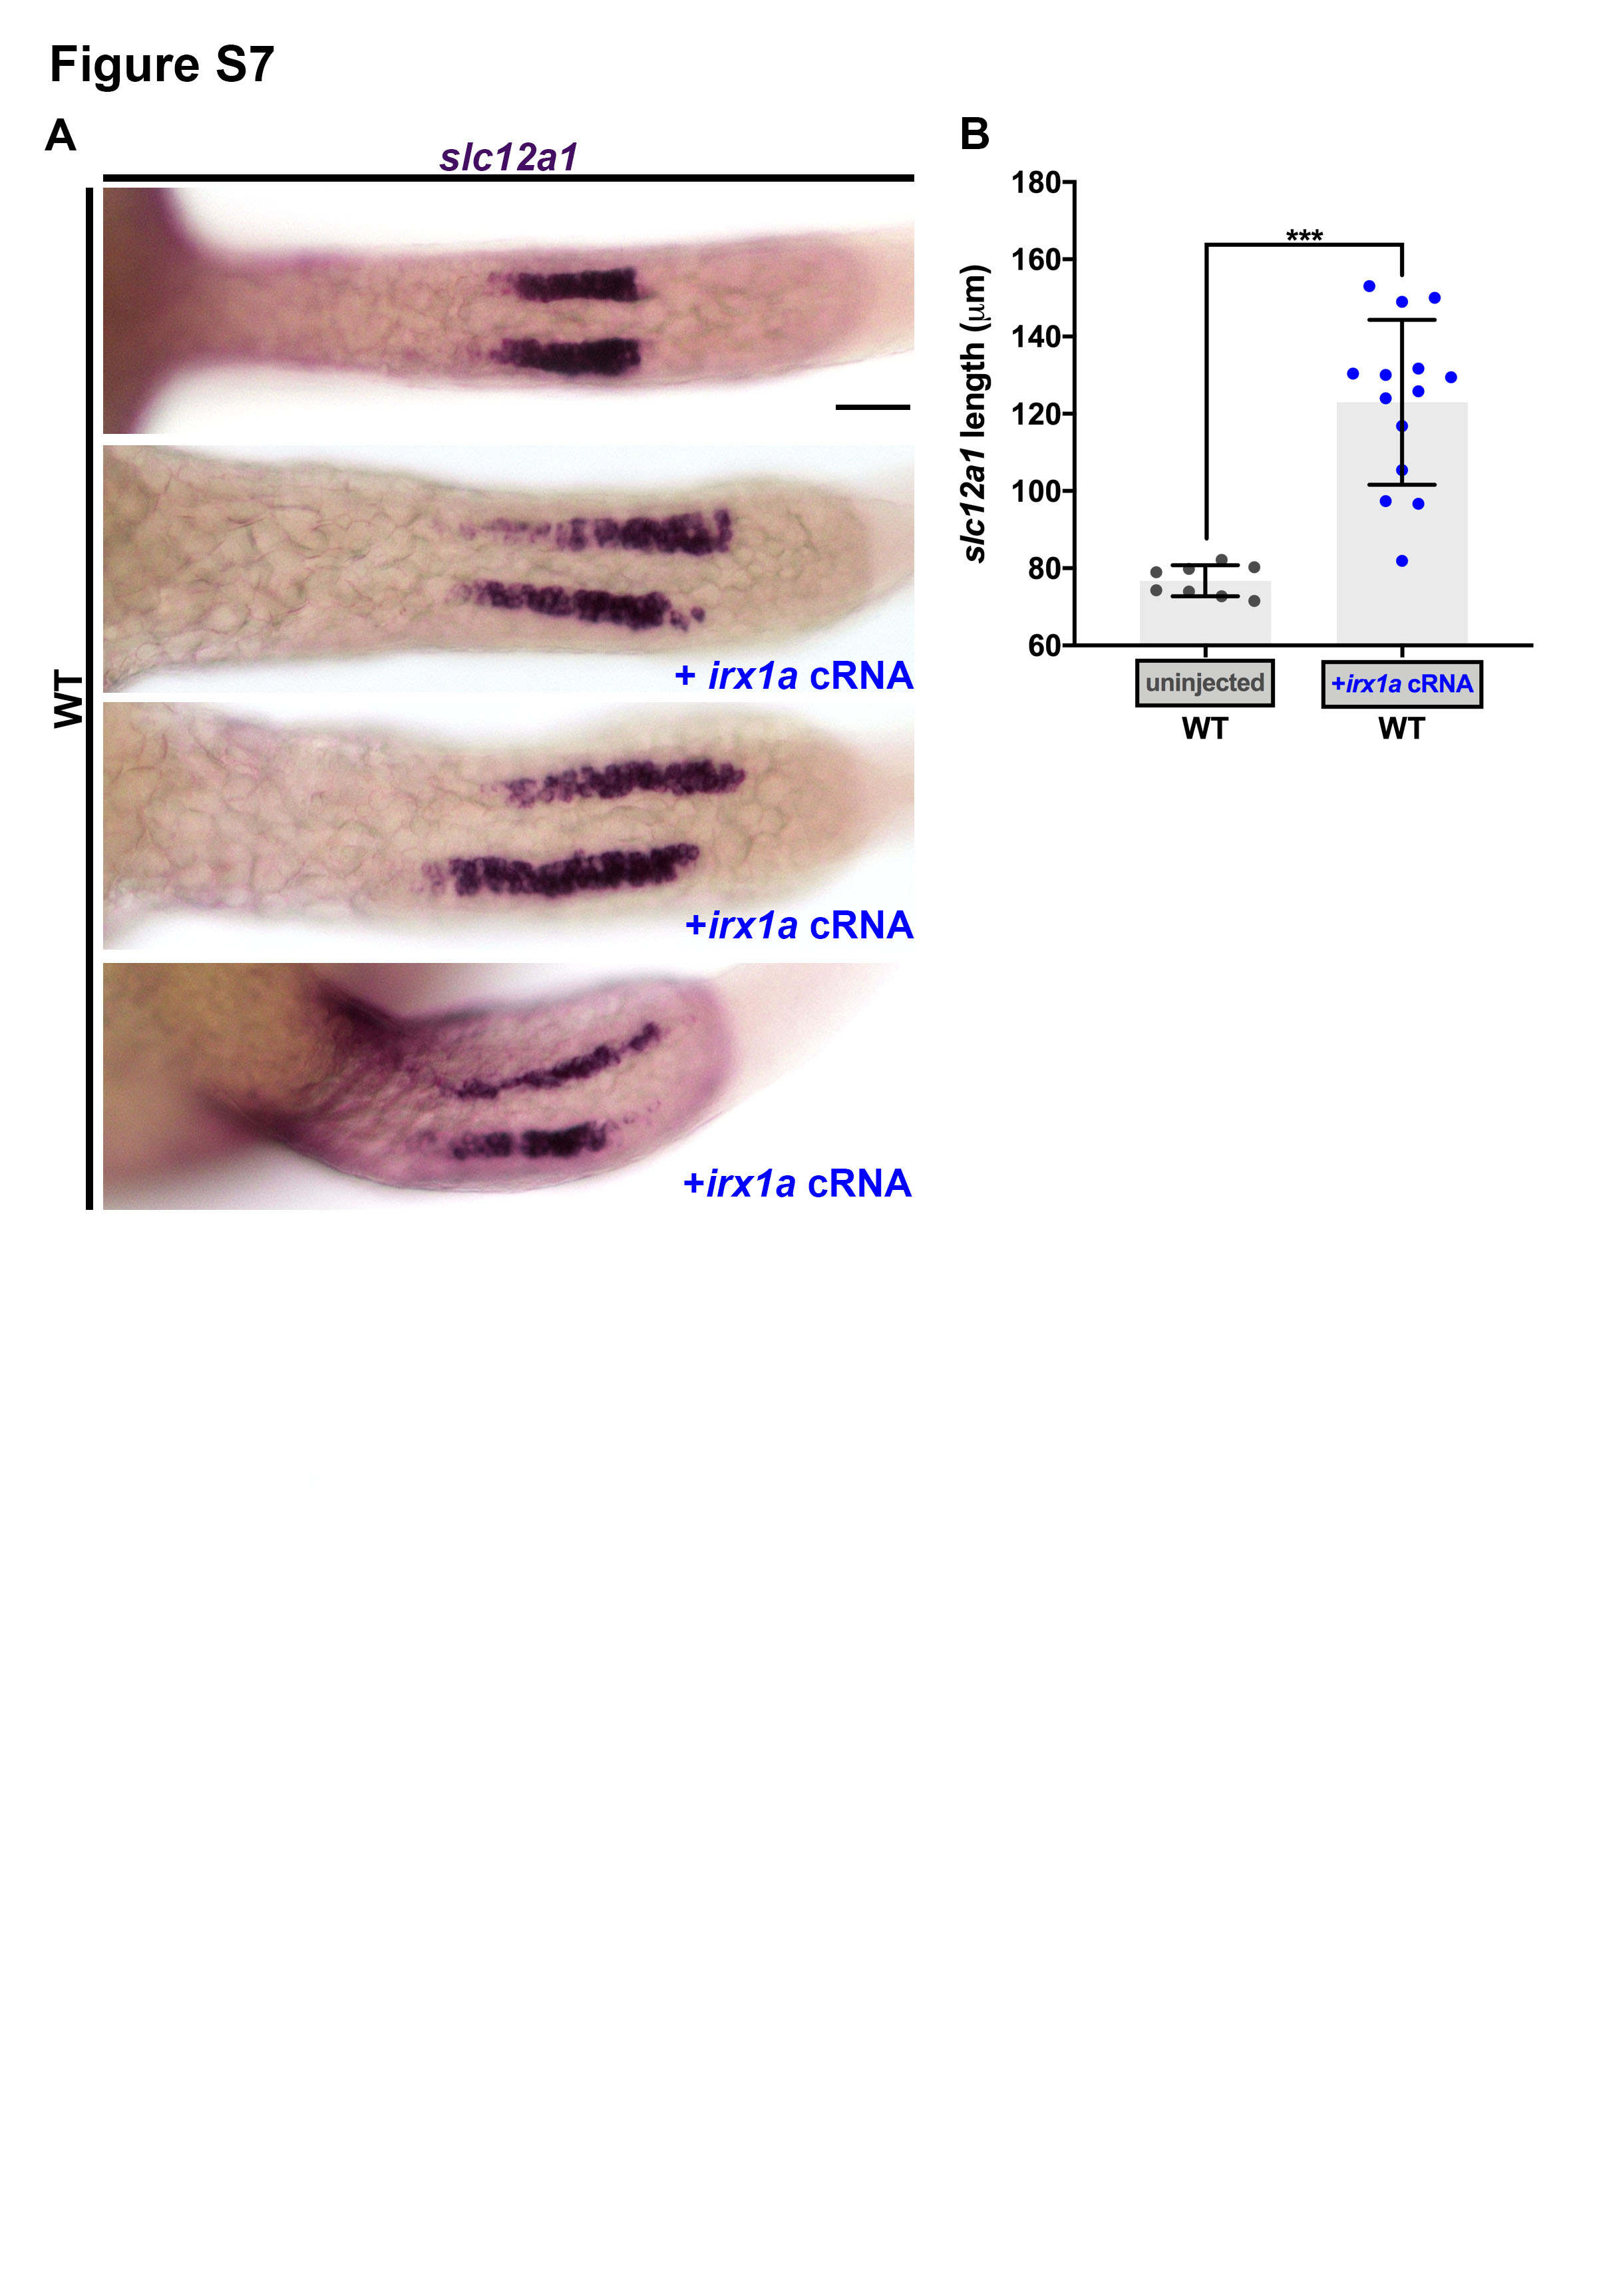
Fig. S7
irx1a overexpression drives slc12a1 expansion. A. WISH showing expanded slc12a1 expression domain in 3 different animals injected with irx1a cRNA as compared to wild-type uninjected control. Scale bar = 35 μm. B. Quantification of absolute lengths of slc12a1 stain per nephron. n ≥ 7 for each control and test group. Measurements were compared by unpaired t-test. Data are represented as ± SD. ***p < 0.001.
Acknowledgments
This image is the copyrighted work of the attributed author or publisher, and
ZFIN has permission only to display this image to its users.
Additional permissions should be obtained from the applicable author or publisher of the image.
Full text @ Development