
Fig. S4
- ID
- ZDB-IMAGE-190923-14
- Publication
- Chambers et al., 2019 - Tfap2a is a novel gatekeeper of nephron differentiation during kidney development
- All Figures
- Figures for Chambers et al., 2019
|
Fig. S4
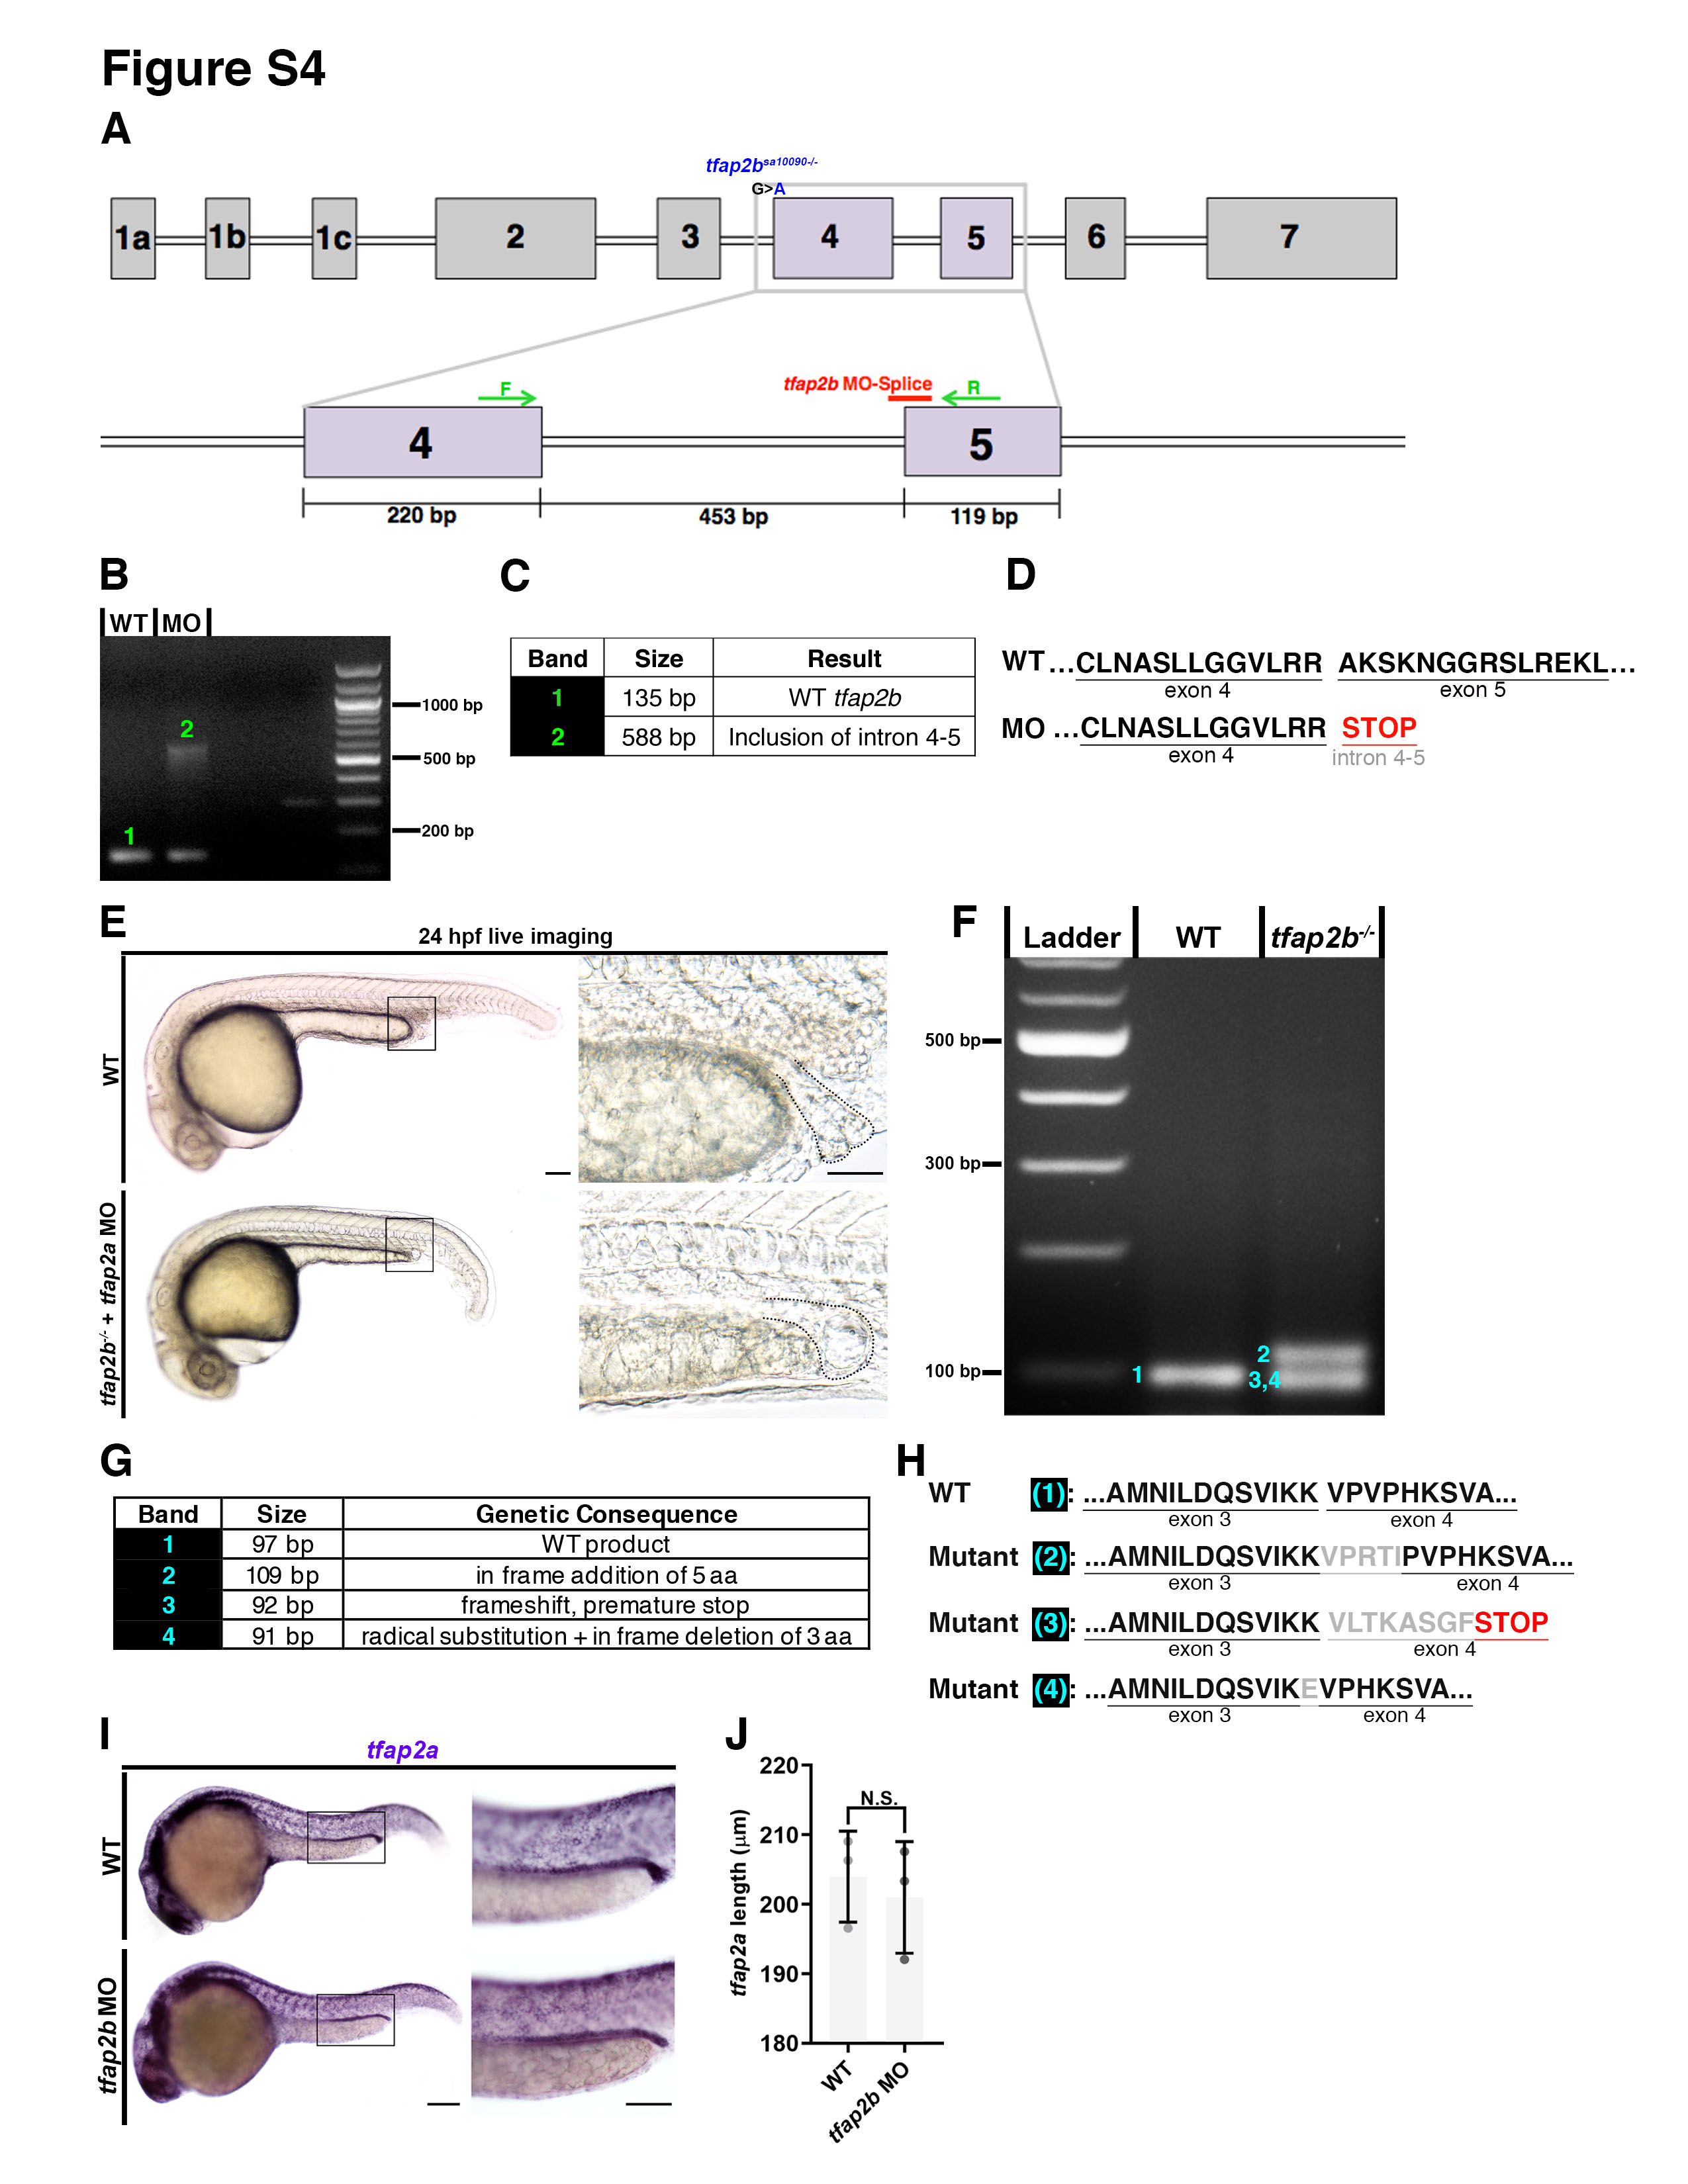
tfap2b MO splice efficacy verification through RT-PCR analysis, and phenotyping of tfap2b morphants and mutants. A. tfap2b exon map: tfap2b MO-splice (red) targets the 3’ end of exon 4. RT-PCR primers are situated within exon 4 and exon 5 (green arrows). tfap2bsa10090 lesion is positioned at the end of the intron before exon 4, blocking an essential splice site (blue). B. RT-PCR gel reveals larger product size in the MO lane, indicating disrupted splicing. 1 = WT band, 2 = MO band. C. Table of sequencing results for each band. D. Predicted WT and tfap2b MO amino acid sequences. Inclusion of intron 4-5 causes premature stop codon (red), and a predicted truncated protein in tfap2b MOs. E. Live imaging. Scale bar = 70 μm F. RT-PCR analysis of tfap2b transcripts in tfap2bsa10090 mutants. 1 = WT band, 2,3,4 = mutant bands. G. Table of sequencing results for each PCR band. H. Predicted WT and tfap2bsa10090 amino acid sequences. I. WISH for tfap2a in tfap2b morphants. Scale bars = 100 μm. J. Quantification of tfap2a domain length for WT and tfap2b morphants.