
|
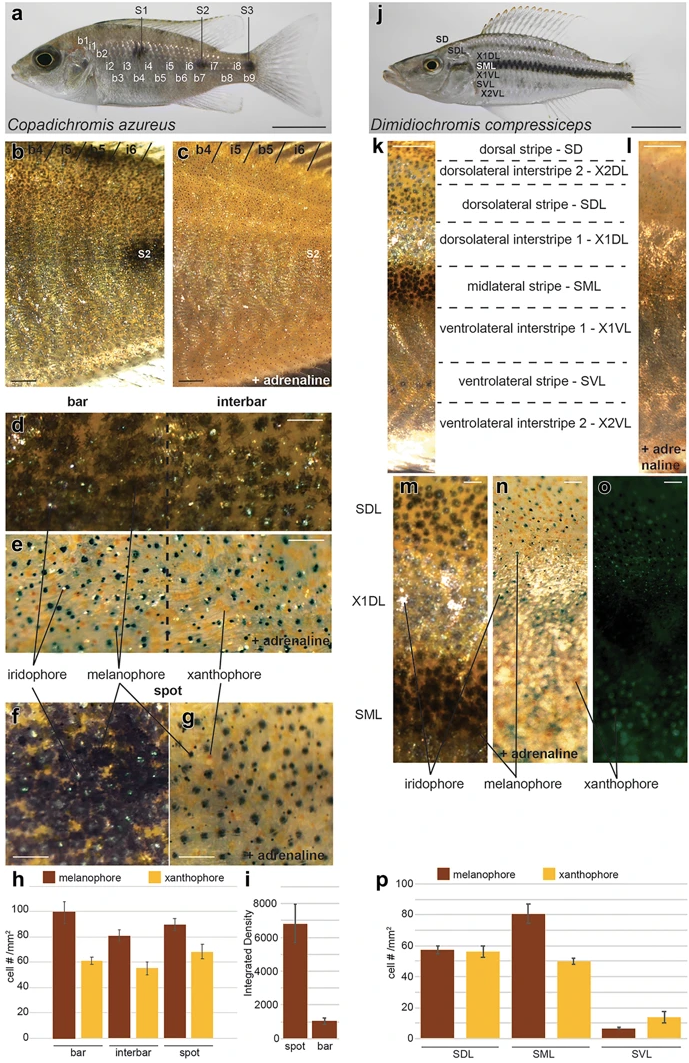
Fig. 1
Adult pigmentation in C. azureus and D. compressiceps. a Vertical bars b1–9, interbars i1–8 and spots S1–3 in C. azureus. b, c Higher magnification images of bars/interbars and spots in C. azureus before (b) and after (c) adrenaline treatment. d, e Melanophores (black), xanthophores (orange) and iridophores (silver) in bars and interbars of C. azureus before (d) and after (e) adrenaline treatment. f, g Melanophores, xanthophores and iridophores of spot in C. azureus before (f) and after (g) adrenaline treatment. h Melanophore and xanthophore average densities in bars, interbars and spots (n = 3) in C. azureus. Error bars represent standard deviations. i Melanophore darkness in spot and bar expressed as integrated density. j Stripes and interstripes in D. compressiceps adult. k, l Higher magnification images of stripes and interstripes in D. compressiceps flank before (k) and after (l) adrenaline treatment. m–o Melanophores, xanthophores and iridophores of stripes SDL and SML and interstripe X1DL before (k, m) and after (l, n) adrenaline treatment. o Lack of xanthophores in interstripe X1DL visualized under fluorescent light (488 nm). p Melanophore and xanthophore average densities in SDL, SML and SVL (n = 3) in D. compressiceps. Error bars represent standard deviations. a, j Scale = 1 cm. b, d, k, l Scale = 1 mm. d–g and m–o Scale = 250 µm