
Image
|
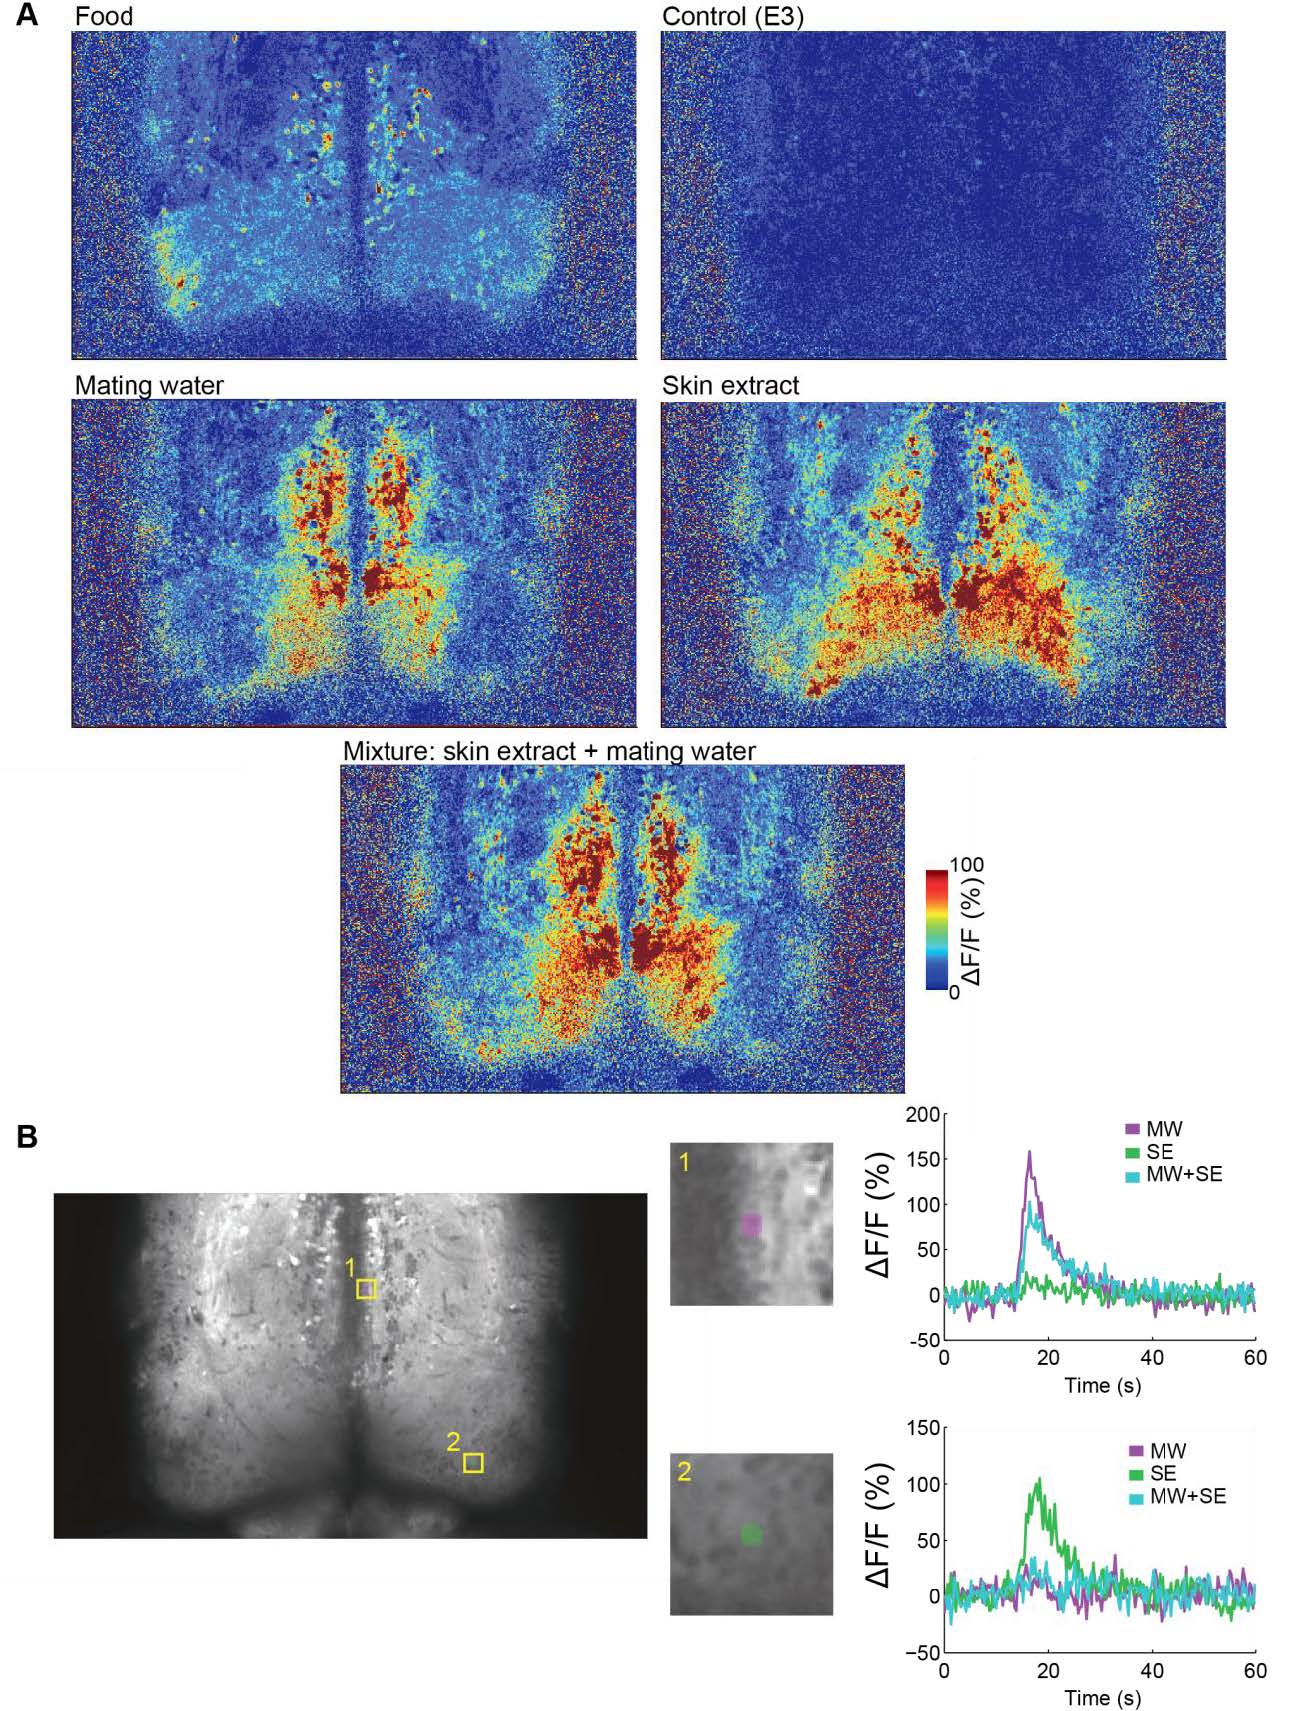
Figure Caption
Fig. S3
Raw data from 2-photon calcium imaging of telencephalon. Related to Figure 3. (A) Odor-evoked activity map (mean F/F signal during 5 s post-stimulus delivery) of the telencephalic section in B to different stimuli: food, control (E3), mating water, skin extract and mixture of mating water and skin extract. (B) Left: anatomical section of 2-photon imaged telencephalon in 34 day-old juvenile tuba1a:GCaMP6s zebrafish with two sample rois (1, 2) highlighted. Right: mean ΔF/F signal of the two sample rois to each stimulus. Scale = 50μm.
Acknowledgments
This image is the copyrighted work of the attributed author or publisher, and
ZFIN has permission only to display this image to its users.
Additional permissions should be obtained from the applicable author or publisher of the image.
Full text @ Curr. Biol.