
Fig. S8
- ID
- ZDB-IMAGE-190910-30
- Publication
- Bonkhofer et al., 2019 - Blood stem cell-forming haemogenic endothelium in zebrafish derives from arterial endothelium
- All Figures
- Figures for Bonkhofer et al., 2019
|
Fig. S8
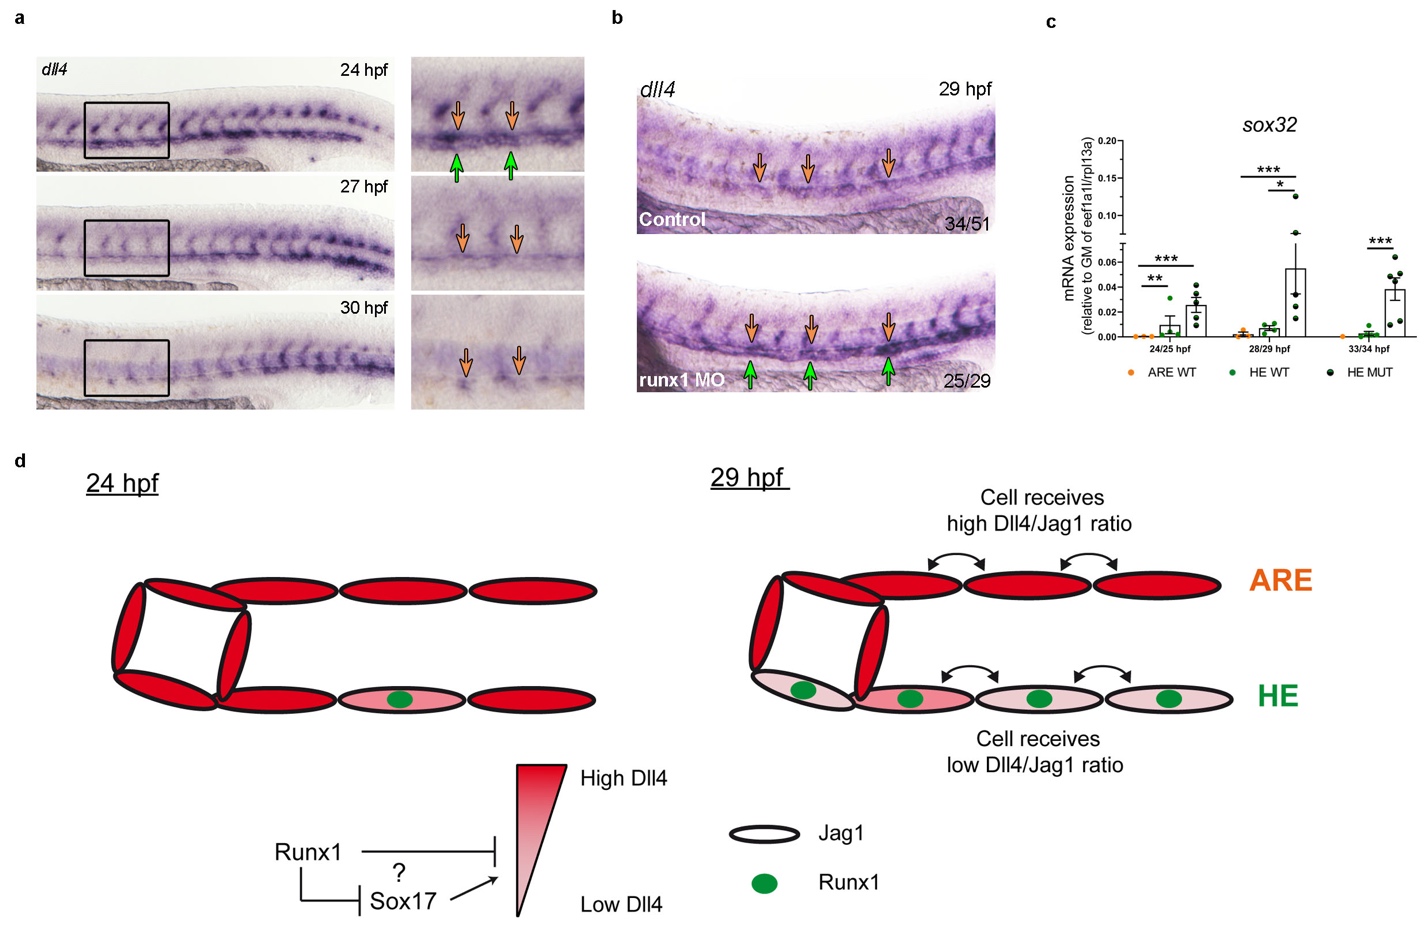
Down-regulated expression of dll4 in HE accounts for a lower Dll4 to jag1a ratio driving haemogenic specification (a,b) Spatial analysis of gene expression by ISH. Green arrows point to the HE. Orange arrows point to the DA roof. (a) Time line analysis of dll4 during definitive haematopoiesis in the DA region. The magnifications highlight the boxed regions. (b) ISH analysis of dll4 in runx MO and control embryos. (c) qRT-PCR gene expression analysis of sox32 in the HE and ARE of runx1+/+ (WT) and the HE of runx1-/- mutant (MUT) embryos. Graph shows the mean of detected expression levels relative to the geometric mean (GM) of the 2 housekeeping genes eef1a1l and rpl13a. n = 5 independent biological experiments for WT embryos and n = 6 independent biological experiments for MUT embryos. Error bars represent the SEM. 2-way ANOVA; * = p<0.05; ** = p<0.01; *** = p<0.001. (d) Model depicting the dynamics of NOTCH ligands jag1a