
Fig. 2
- ID
- ZDB-IMAGE-190910-25
- Genes
- Publication
- Bonkhofer et al., 2019 - Blood stem cell-forming haemogenic endothelium in zebrafish derives from arterial endothelium
- All Figures
- Figures for Bonkhofer et al., 2019
|
Fig. 2
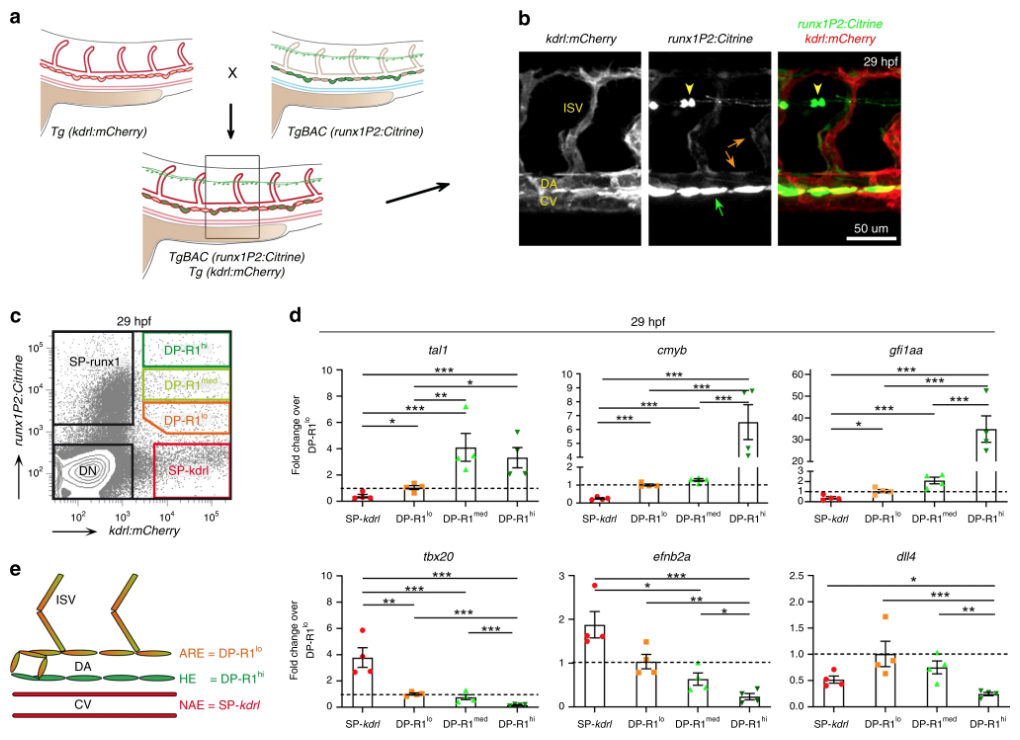
FACS based isolation of haemogenic and aortic roof endothelium. a Schematic of transgene expression in the trunk region of double transgenic TgBAC(runx1P2:Citrine);Tg(kdrl:mCherry) embryos during definitive haematopoiesis. b Representative confocal image of the DA region of double transgenic TgBAC(runx1P2:Citrine);Tg(kdrl:mCherry) embryos at 29 hpf. Laser intensities enhanced to detect Citrine fluorescence in the DA roof and sprouting inter-somitic vessels (ISV) (orange arrows) in addition to the HE (green arrow). Yellow arrow heads: neurons in the spinal cord. c Characteristic FACS plot of the established gating strategy for the isolation of endothelial sub-populations (runx1hikdrl+ [DP-R1hi]; runx1medkdrl+ [DP-R1med]; runx1lokdrl+[DP-R1lo]; runx1−kdrl+ [SP-kdrl]) from double transgenic TgBAC(runx1P2:Citrine);Tg(kdrl:mCherry) embryos. d qRT-PCR analysis of haematopoietic (tal1, cmyb and gfi1aa) and endothelial (tbx20, efnb2a and dll4) marker gene expression in the different cell fractions isolated from ~29 hpf embryos following the FACS gating strategy depicted in (c). Graphs show the measured mean fold change relative to the expression detected in the DP-R1lo fraction. n = 4 independent experiments. Error bars represent the SEM. 1-way ANOVA; *p < 0.05; **p < 0.01; ***p < 0.001. e Schematic of the vessel structure in the zebrafish trunk region discriminating between aortic roof endothelium (ARE) including the ISV, the HE and the non-aortic endothelium (NAE) including but not restricted to endothelial cells from the cardinal vein (CV). The depicted colour code refers to the colours of the FACS gates presented in (c)