
|
Fig. 2
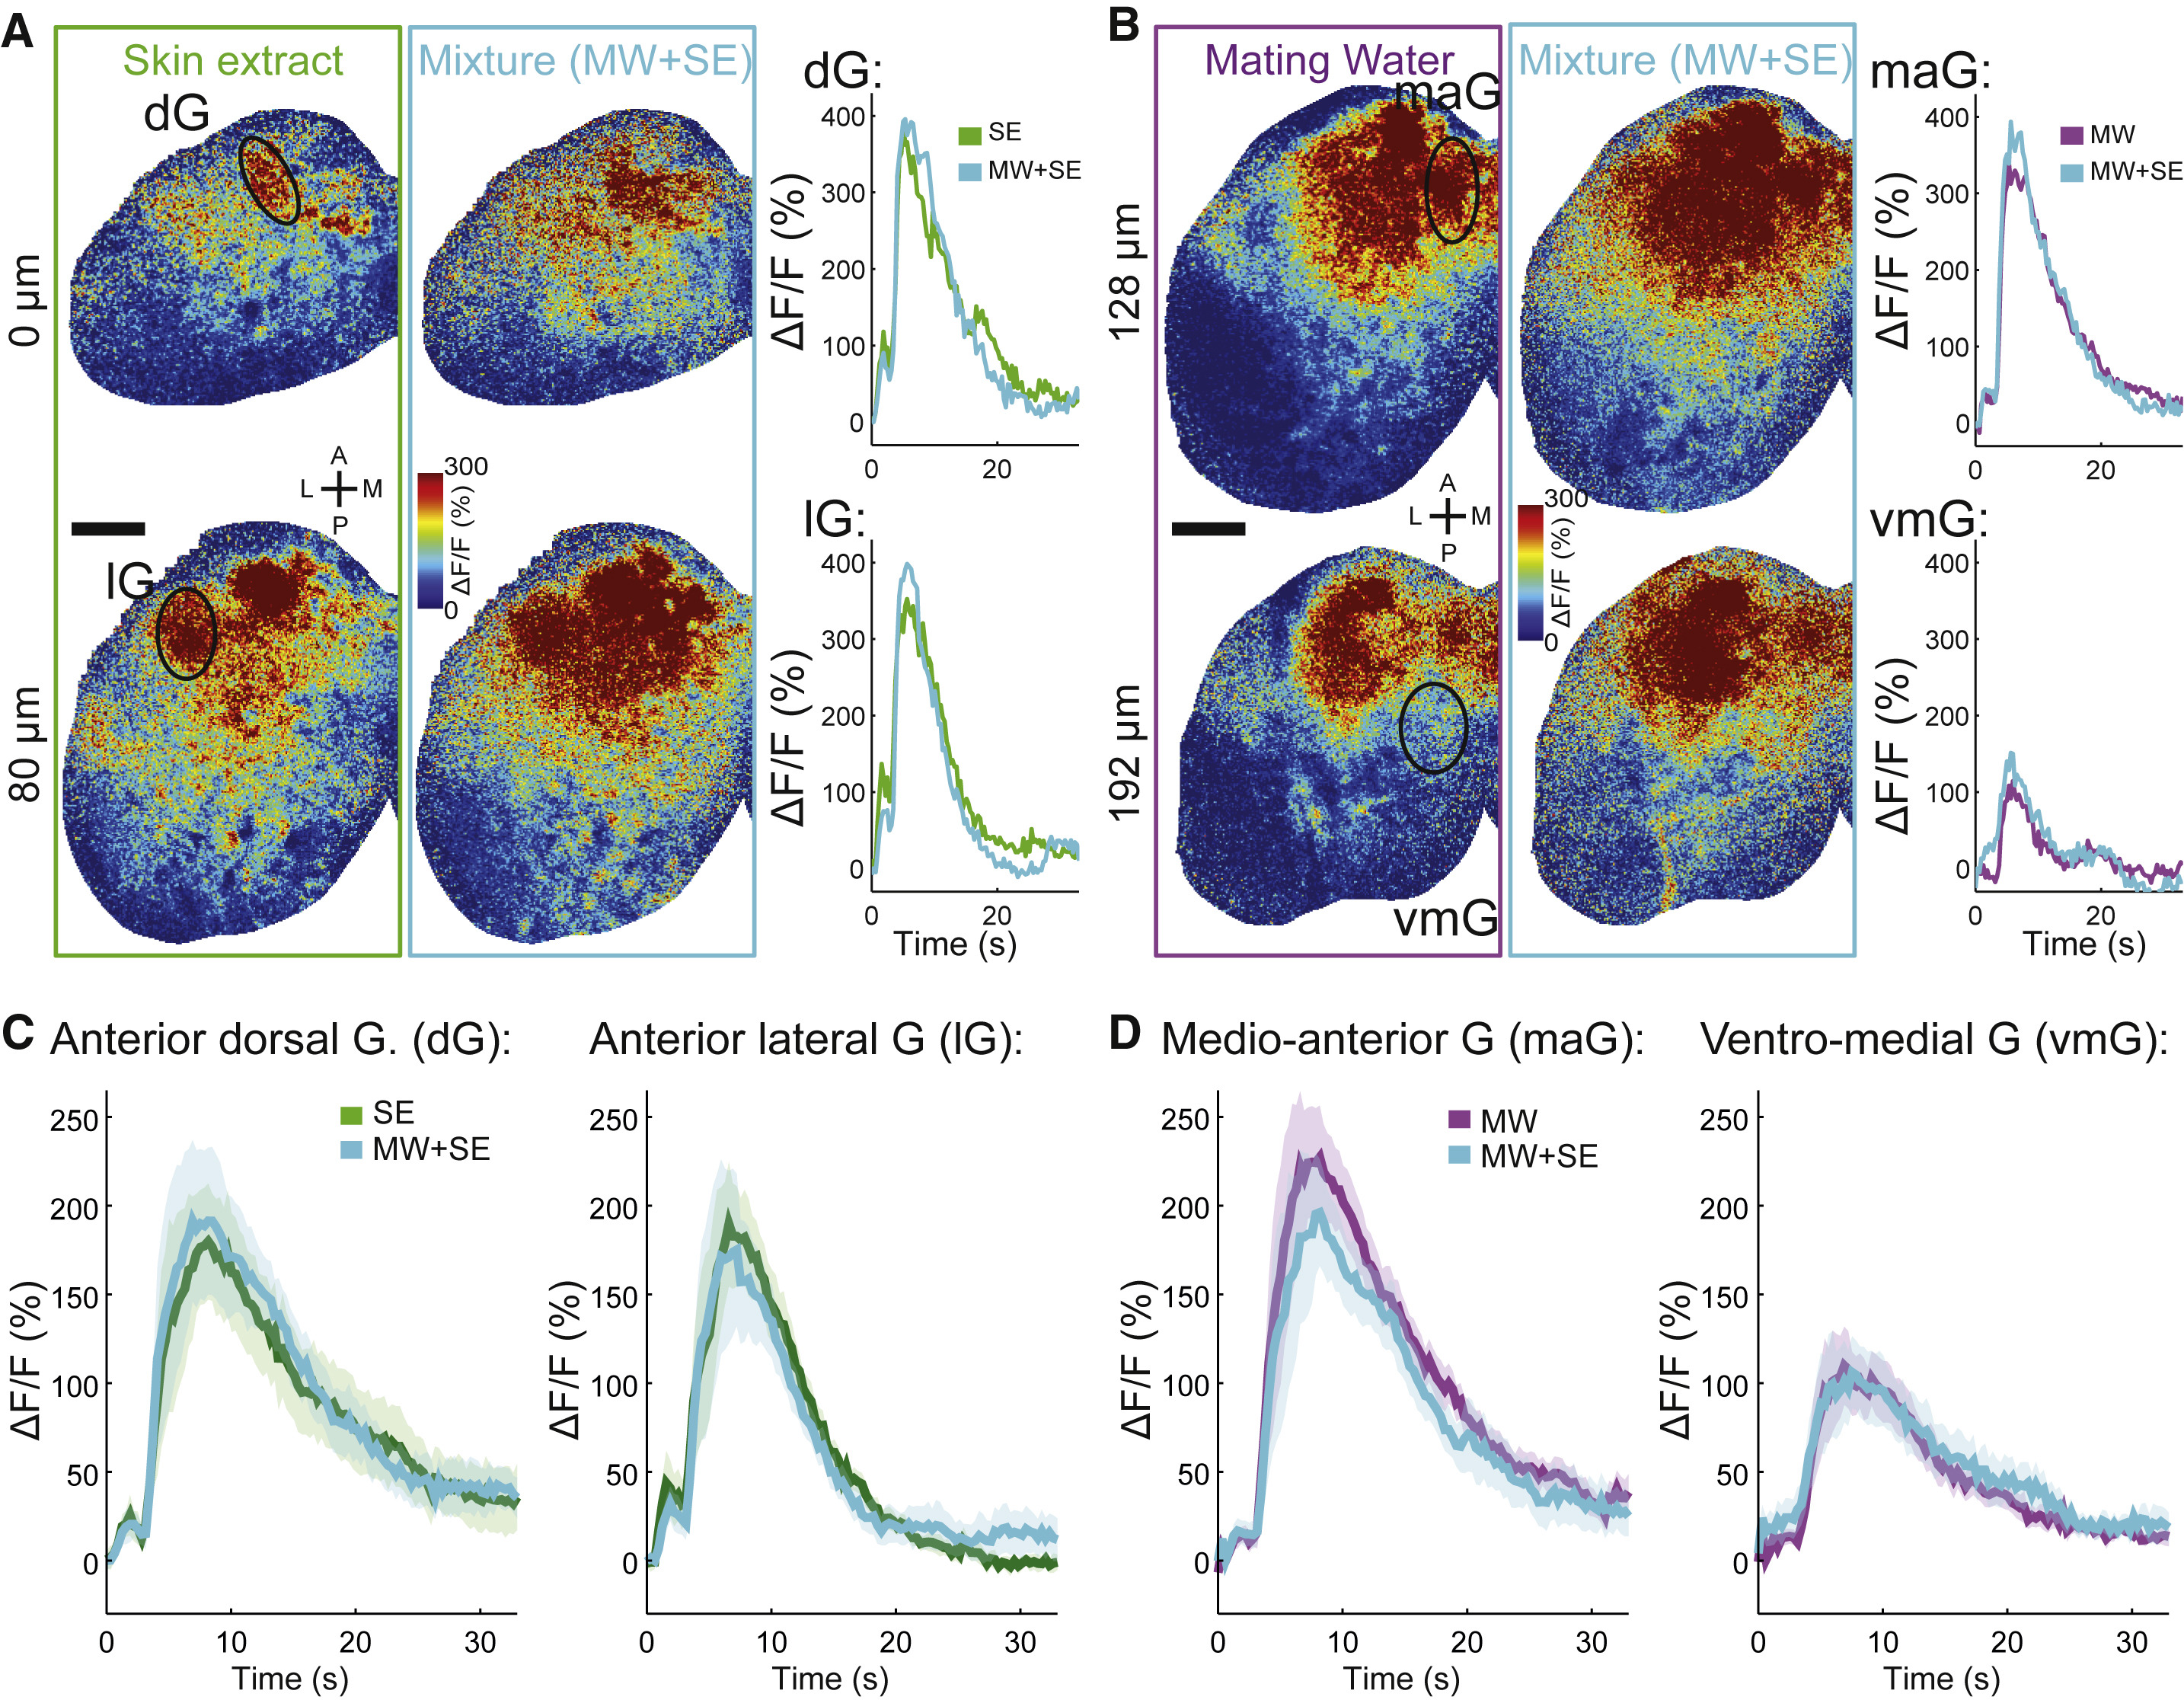
Independent, Non-Interacting Mating-Water and Skin-Extract Activation Patterns in the Olfactory Bulb
(A) Mean response to olfactory stimulation in two optical sections at 0 μm (top) and 80 μm (bottom) depth of the left olfactory bulb (OB) of a 32-day-old juvenile tuba1a:GCaMP6s zebrafish, when exposed to skin extract and the mixture of skin extract and mating water. Ellipses outline representative glomeruli: dorsal (dG) and lateral (lG). Right panel: mean ΔF/F signal traces of odor responses of the glomerulus region of interest annotated in the section.
(B) Mean response to olfactory stimulation in two optical sections at 128 μm (top) and 192 μm (bottom) depth of the left OB of the same fish as in (A) and when exposed to mating water and the mixture of skin extract and mating water. Ellipses outline representative glomeruli: medio-anterior (maG) and ventromedial glomerular (vmG) clusters. Right panel: mean ΔF/F signal traces of odor responses of the glomerulus region of interest annotated in the section.
(C) Mean ΔF/F signal traces of odor responses within each OB glomerulus region of interest annotated in (A) (n = 7 fish). Shaded regions denote the standard error of the mean.
(D) Mean ΔF/F signal traces of odor responses within each OB glomerulus region of interest annotated in B (n = 7 fish). Shaded regions denote the standard error of the mean.
See also Figure S2 and Video S3.
lG, lateral glomerular; dG, dorsal glomerular; maG, medio-anterior glomerular; vmG, ventro-medial glomerular; A, anterior; P, posterior; M, medial; L, lateral (L). Scale bar, 50 μm.