
|
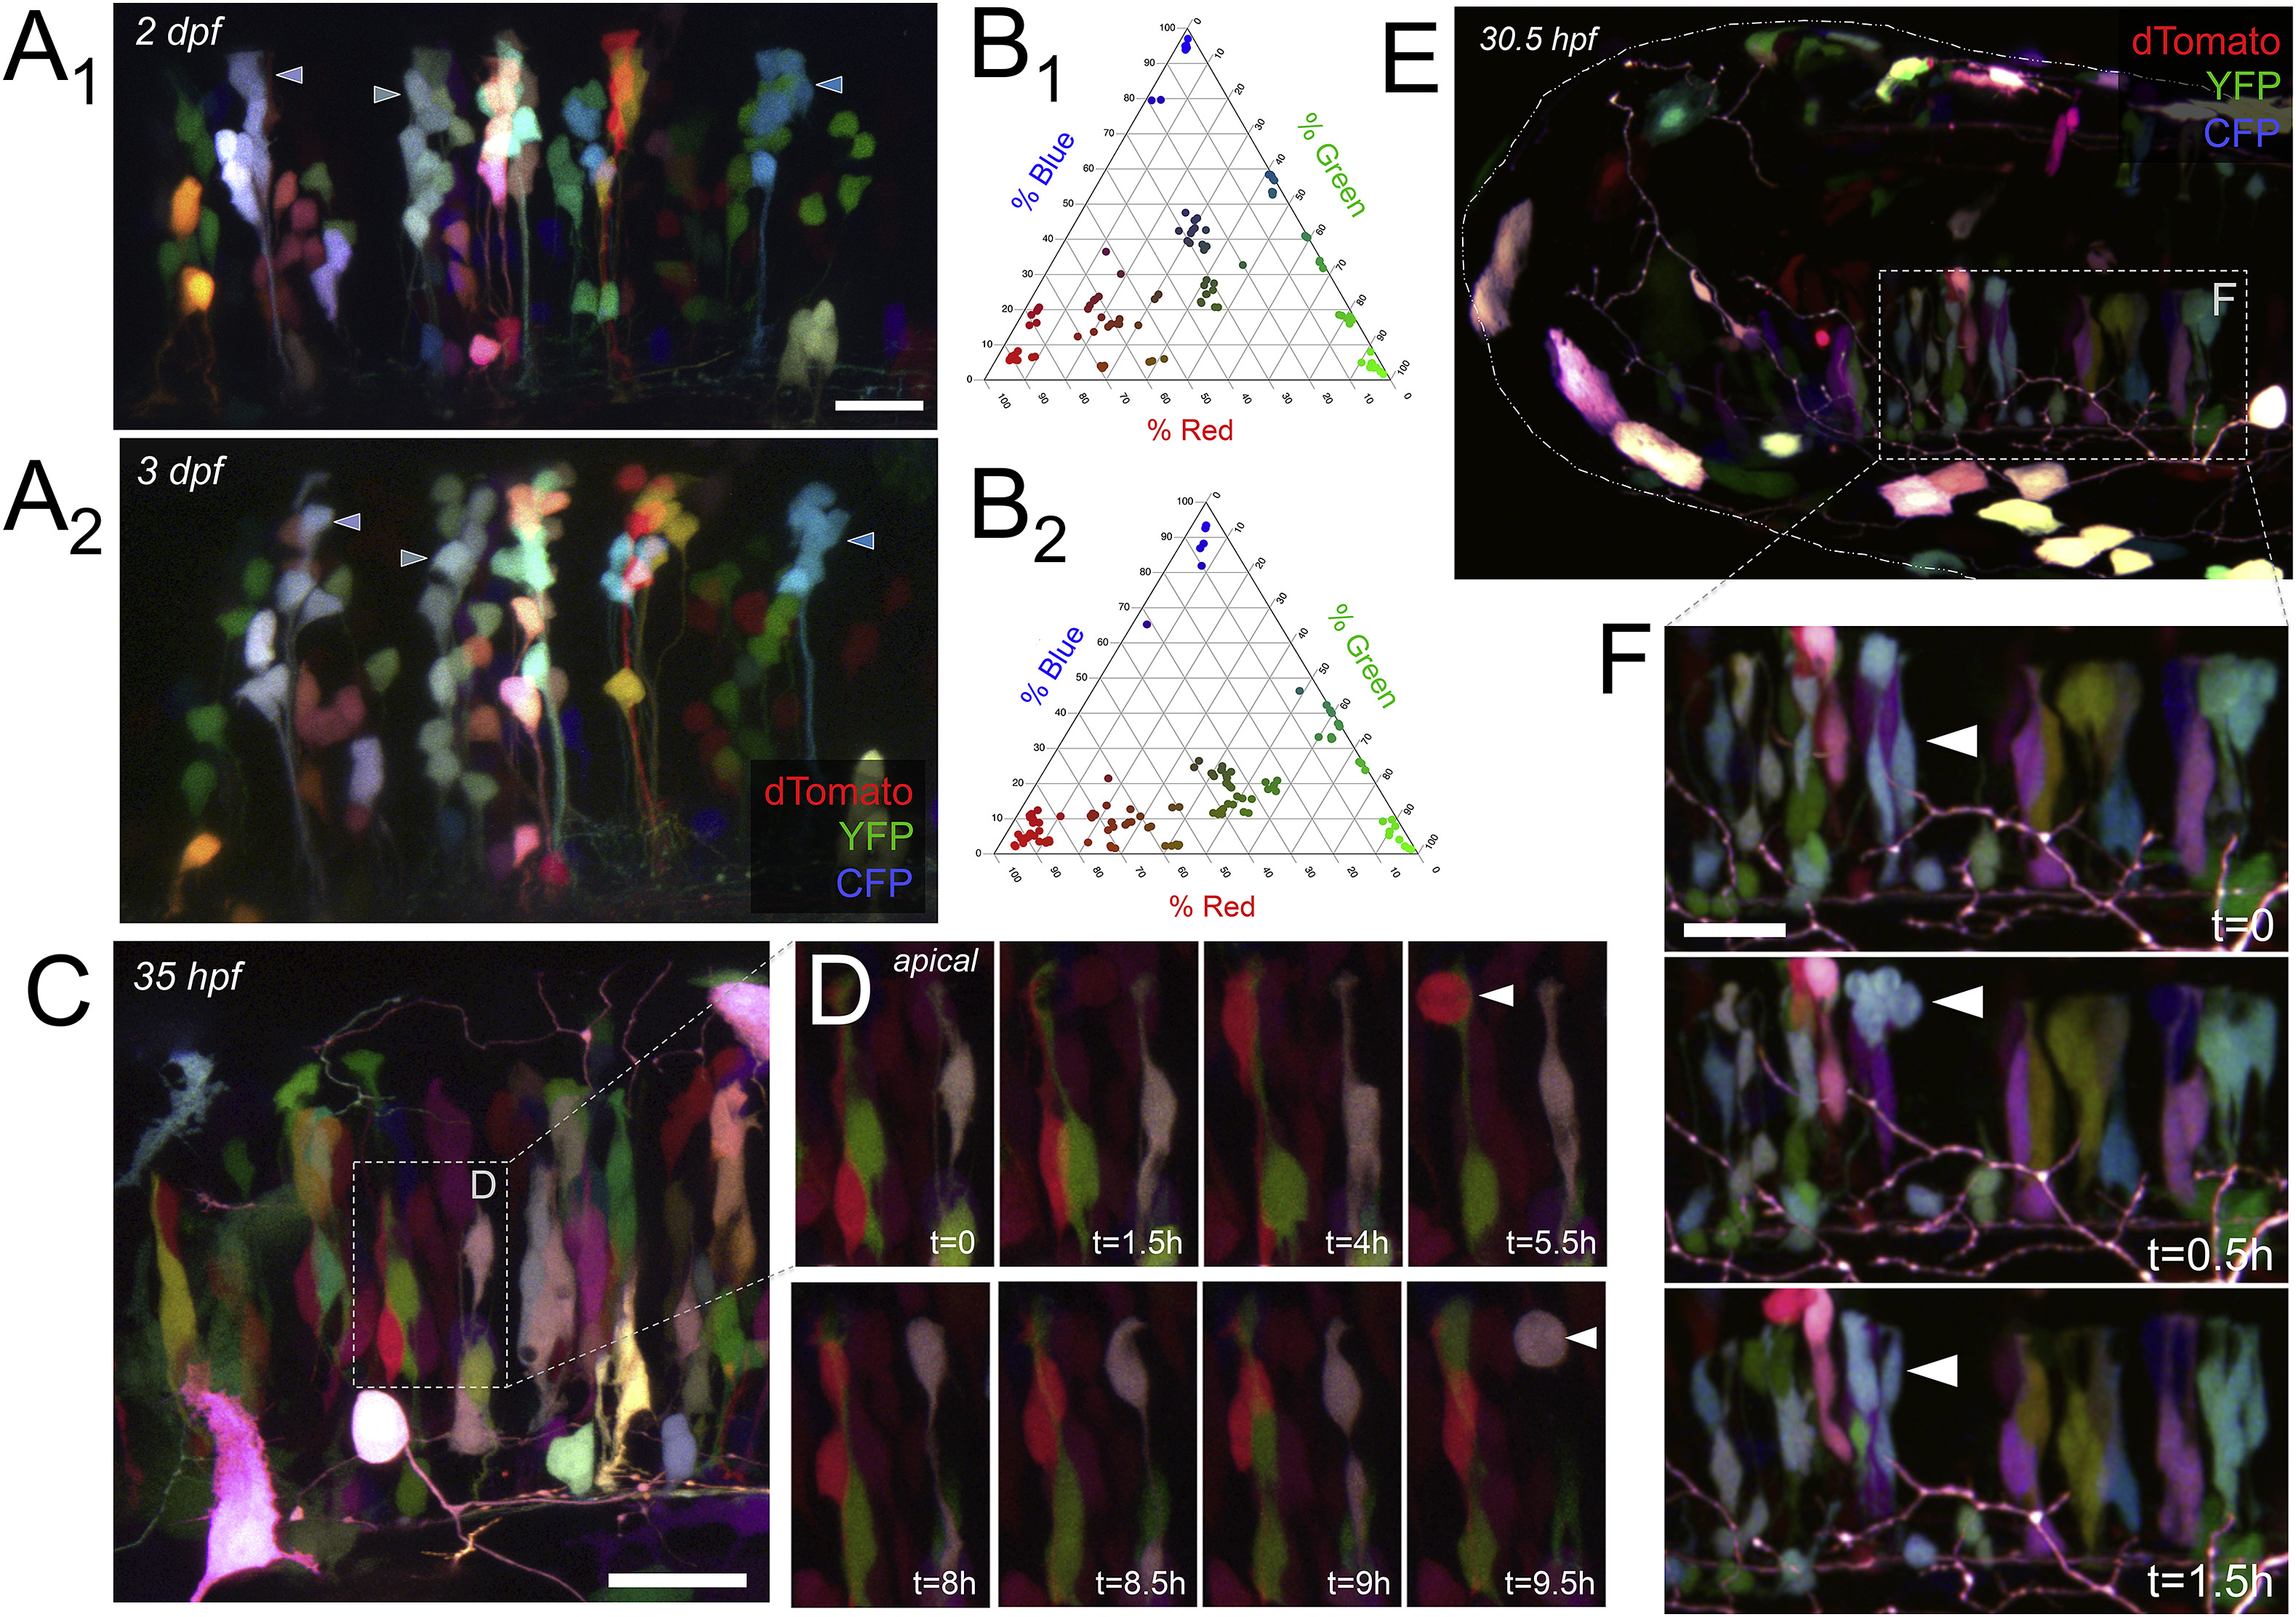
Fig. 2
Time-lapse in vivo imaging combined with Brainbow color-coding distinguishes multiple neighboring clones of cells undergoing interkinetic nuclear migration and dividing.
A) Color-coded radial clusters labeled in one fish expressing Brainbow at 2 dpf (55 hpf; A1) and 3 dpf (71 hpf; A2); maximum intensity projections representing 62μm and 47μm respectively. Three color-coded radial clusters are identified with arrowheads at each time point. The color of all Brainbow-labeled cells in A1 and A2is quantified as relative channel weights in the corresponding ternary plots in B1 and B2 (n=106 cells, 119 cells). C) Zebrafish hindbrain at 35 hpf labeled with Brainbow (maximum intensity projection showing 24μm); inset indicated with dashed white box is the first time point displayed in D. D) Series of time points taken at 30 min intervals in the hindbrain from C. Over period of 9.5 h shown, labeled cells underwent interkinetic nuclear migration; white arrowheads indicate a cell at the apical surface. Rounding up of the cell soma at the apical surface and a corresponding increase in clone number (e.g., red cell at 5.5h and then 8h) was considered a mitotic event. E) Dorsolateral view of zebrafish hindbrain at 30.5 hpf labeled with Brainbow, where white dashed-and-dotted line shows approximate boundary of head, and white dashed box indicates inset shown in first time point of F. F) Series of time points taken at 30 min intervals in the hindbrain from E. Over a period of 1.5 h, two blue cells indicated by the white arrowheads can be observed moving to the apical surface and undergoing mitosis, suggesting a clone containing two progenitor cells. Scale bar represents 20μm in A, 25μm in C, and 20μm in F. In A through D, dorsal is up and rostral is to the left. In E and F, rostral is to the left. In all images, dTomato is coded as red, YFP is coded as green, and CFP is coded as blue.
Reprinted from Developmental Biology, 453(2), Brockway, N.L., Cook, Z.T., O'Gallagher, M., Tobias, Z.J.C., Gedi, M., Carey, K.M., Unni, V.K., Pan, Y.A., Metz, M.R., Weissman, T.A., Multicolor lineage tracing using in vivo time-lapse imaging reveals coordinated death of clonally related cells in the developing vertebrate brain, 130-140, Copyright (2019) with permission from Elsevier. Full text @ Dev. Biol.