
Fig. 3
- ID
- ZDB-IMAGE-190909-24
- Publication
- Bailey et al., 2019 - NAD+ improves neuromuscular development in a zebrafish model of FKRP-associated dystroglycanopathy
- All Figures
- Figures for Bailey et al., 2019
|
Fig. 3
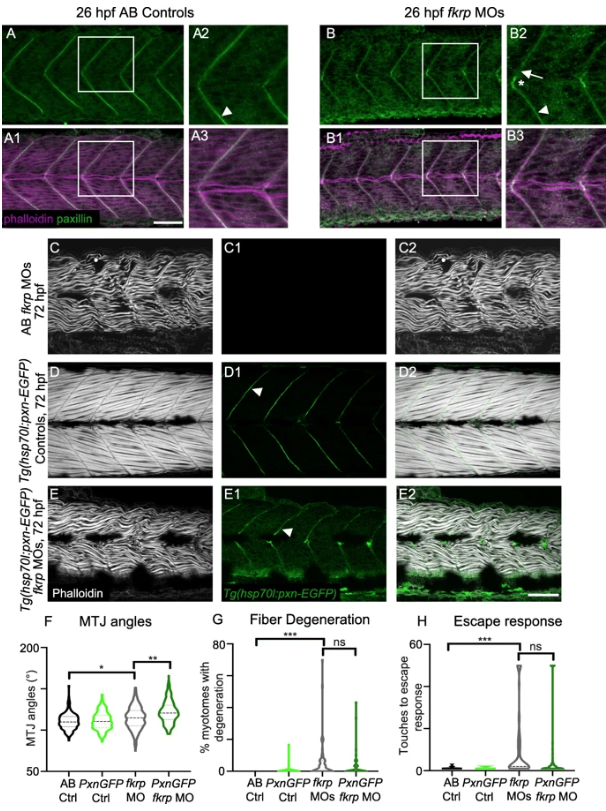
Paxillin overexpression does not improve muscle structure in fkrp morphants. (A–B3) Anterior left, dorsal top, side-mounted embryos at 26 hpf stained for Paxillin (green) and f-actin (purple). Paxillin concentrates at the MTJ (white arrowhead) in control embryos. There are some gaps in Paxillin localization in fkrp morphants (B2, white arrow) and Paxillin accumulates at the muscle pioneers (B2, white asterisk). (C–E2) Anterior left, dorsal top, side-mounted embryos at 72 hpf stained for f-actin (phalloidin, gray) in lettered and even numbered panels and expressing Paxillin-EGFP (green) in numbered panels. (C–C2) A fkrp morphant with disorganized muscle fibers. (D–D2) Control Tg (hsp70l:pxna-EGFP) embryo expressing Paxillin which concentrates at the MTJ (white arrowhead). (E–E2) Tg (hsp70l:pxna-EGFP) fkrp morphant. (F) MTJ angle quantification. Fkrp morphants with (n = 241 MTJs) and without (n = 170 MTJs) Paxillin-EGFP expression have a significant increase in average MTJ angle width compared with uninjected controls (n = 189, 191 MTJs). Paxillin overexpression in fkrp morphants significantly increases MTJ angles compared to morphants that do not overexpress Paxillin. (G) Fiber degeneration quantification. Fkrp morphants with (n = 55 embryos) and without (n = 60 embryos) Paxillin-EGFP expression have a significant increase in the percent of myotomes with degeneration per embryo compared to uninjected controls (n = 57, 54 embryos). Although there is a trend, Paxillin-overexpressing morphants do not have a significant reduction in dystrophy compared to control fkrp morphants. (H) Escape response quantification. Fkrpmorphants with (n = 88 embryos) and without (n = 70 embryos) Paxillin-EGFP expression require significantly more touches to induce an escape response compared with uninjected controls (n = 66, 80 embryos). Fkrp morphants overexpressing Paxillin do not exhibit a significant improvement in escape response compared with fkrp morphants that do not overexpress Paxillin. Scalebars are 50 μm. *p < 0.05, **p < 0.01, ***p < 0.001, ns non-significant