
|
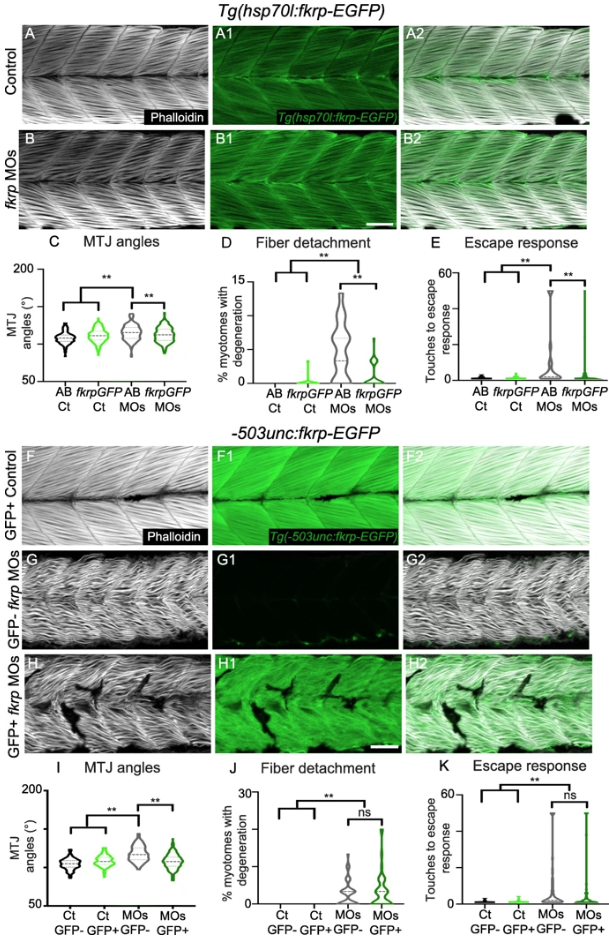
Fig. 8
Muscle-specific overexpression of Fkrp improves MTJ angles, but not motility or fiber resiliency. (A–B2) Anterior left, dorsal top, side-mounted embryos at 72 hpf stained for f-actin (phalloidin, gray) and expressing Fkrp-EGFP (green). (A–A2) Control Tg (hsp70l:fkrp-EGFP) embryo expressing Fkrp in the fibers. (B–B2) fkrp morphant Tg (hsp70l:fkrp-EGFP) embryo expressing Fkrp in fibers. (C) MTJ angles of Tg (hsp70l:fkrp-EGFP) control (n = 264 MTJs) and fkrp morphant (n = 340 MTJs) embryos and AB controls and morphants (n = 141, 194 MTJs) at 72 hpf. Constitutive expression of Fkrp improves MTJ angles in morphants. (D) Constitutive expression of Fkrp in morphants (n = 72 embryos) significantly reduces the number of myotomes with fiber degeneration compared with control morphants (n = 35 embryos). (E) The escape response is significantly reduced in fkrp morphants constitutively overexpressing Fkrp (n = 82 embryos) compared to control morphants (n = 44 embryos). (F–H2) Anterior left, dorsal top, side-mounted embryos at 72 hpf stained for f-actin (phalloidin, gray) and expressing Fkrp-EGFP under control of the muscle-specific -503unc promoter (green). (F) Control Tg(-503unc:fkrp-EGFP) embryo expressing Fkrp specifically in muscle fibers. G) fkrp morphant embryo on Tg(-503unc:fkrp-EGFP) background lacking Fkrp expression in muscle fibers. (H) fkrp morphant Tg(-503unc:fkrp-EGFP) embryo expressing Fkrp specifically in muscle fibers does not show improved muscle organization. (I) Muscle specific expression of FKRP in fkrp morphants (n = 158 MTJs) significantly improves MTJ angles compared to control morphants (n = 153 MTJs). (J) Muscle-specific overexpression of Fkrp (n = 45 embryos) does not significantly lower the percent of myotomes with muscle degeneration in control fkrp morphants (n = 47 embryos). (K) There is not a significant difference in the number of touches required to induce an escape response in fkrp morphants that overexpress Fkrp (n = 73 embryos) in muscle versus those that do not (n = 79 embryos). Scalebars are 50 μm. *p < 0.05, **p < 0.01, ns non-significant