
|
Fig. 1
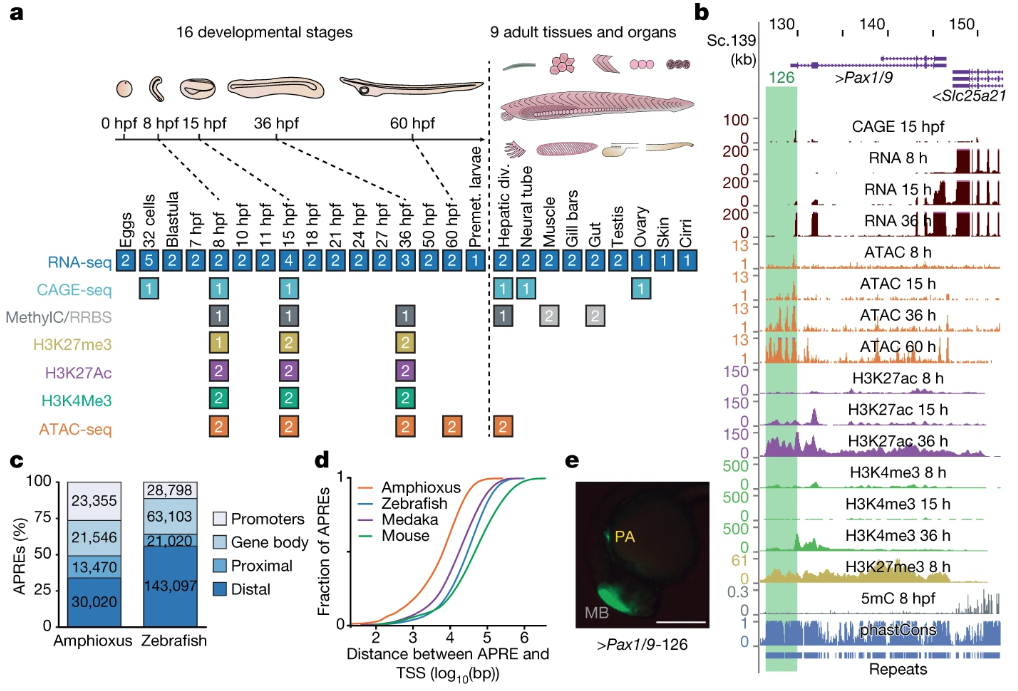
a, Summary of the 94 amphioxus samples generated in this study, comprising eight functional-genomic datasets. The number of biological replicates is indicated for each sample type. div., diverticulum; MethylC/RRBS, methylC sequencing and reduced representation bisulfite sequencing; Premet., premetamorphic. b, Genome browser excerpt showing a selection of available tracks, including gene annotation, sequence conservation (using phastCons), repeats and several epigenomic and transcriptomic datasets. Green rectangle highlights the APRE tested in e. c, Numbers and proportions of amphioxus and zebrafish APREs according to their genomic location. Promoters, within 1-kbp upstream and 0.5-kbp downstream of an annotated TSS; gene body, within an orthology-supported gene; proximal, within 5-kbp upstream of (but not overlapping with) a TSS; distal, not in the aforementioned categories. d, Cumulative distributions of the distance between each APRE and the closest annotated TSS in each species. e, Lateral view of a representative transgenic zebrafish 26-hpf embryo showing GFP expression driven by an amphioxus APRE associated with Pax1/9 (‘Pax1/9-126’, highlighted in b) in pharyngeal arches (PA; n = 4/4). Positive-control enhancer was expressed in the midbrain (MB). Scale bar, 250 μm