
Image
|
Figure Caption
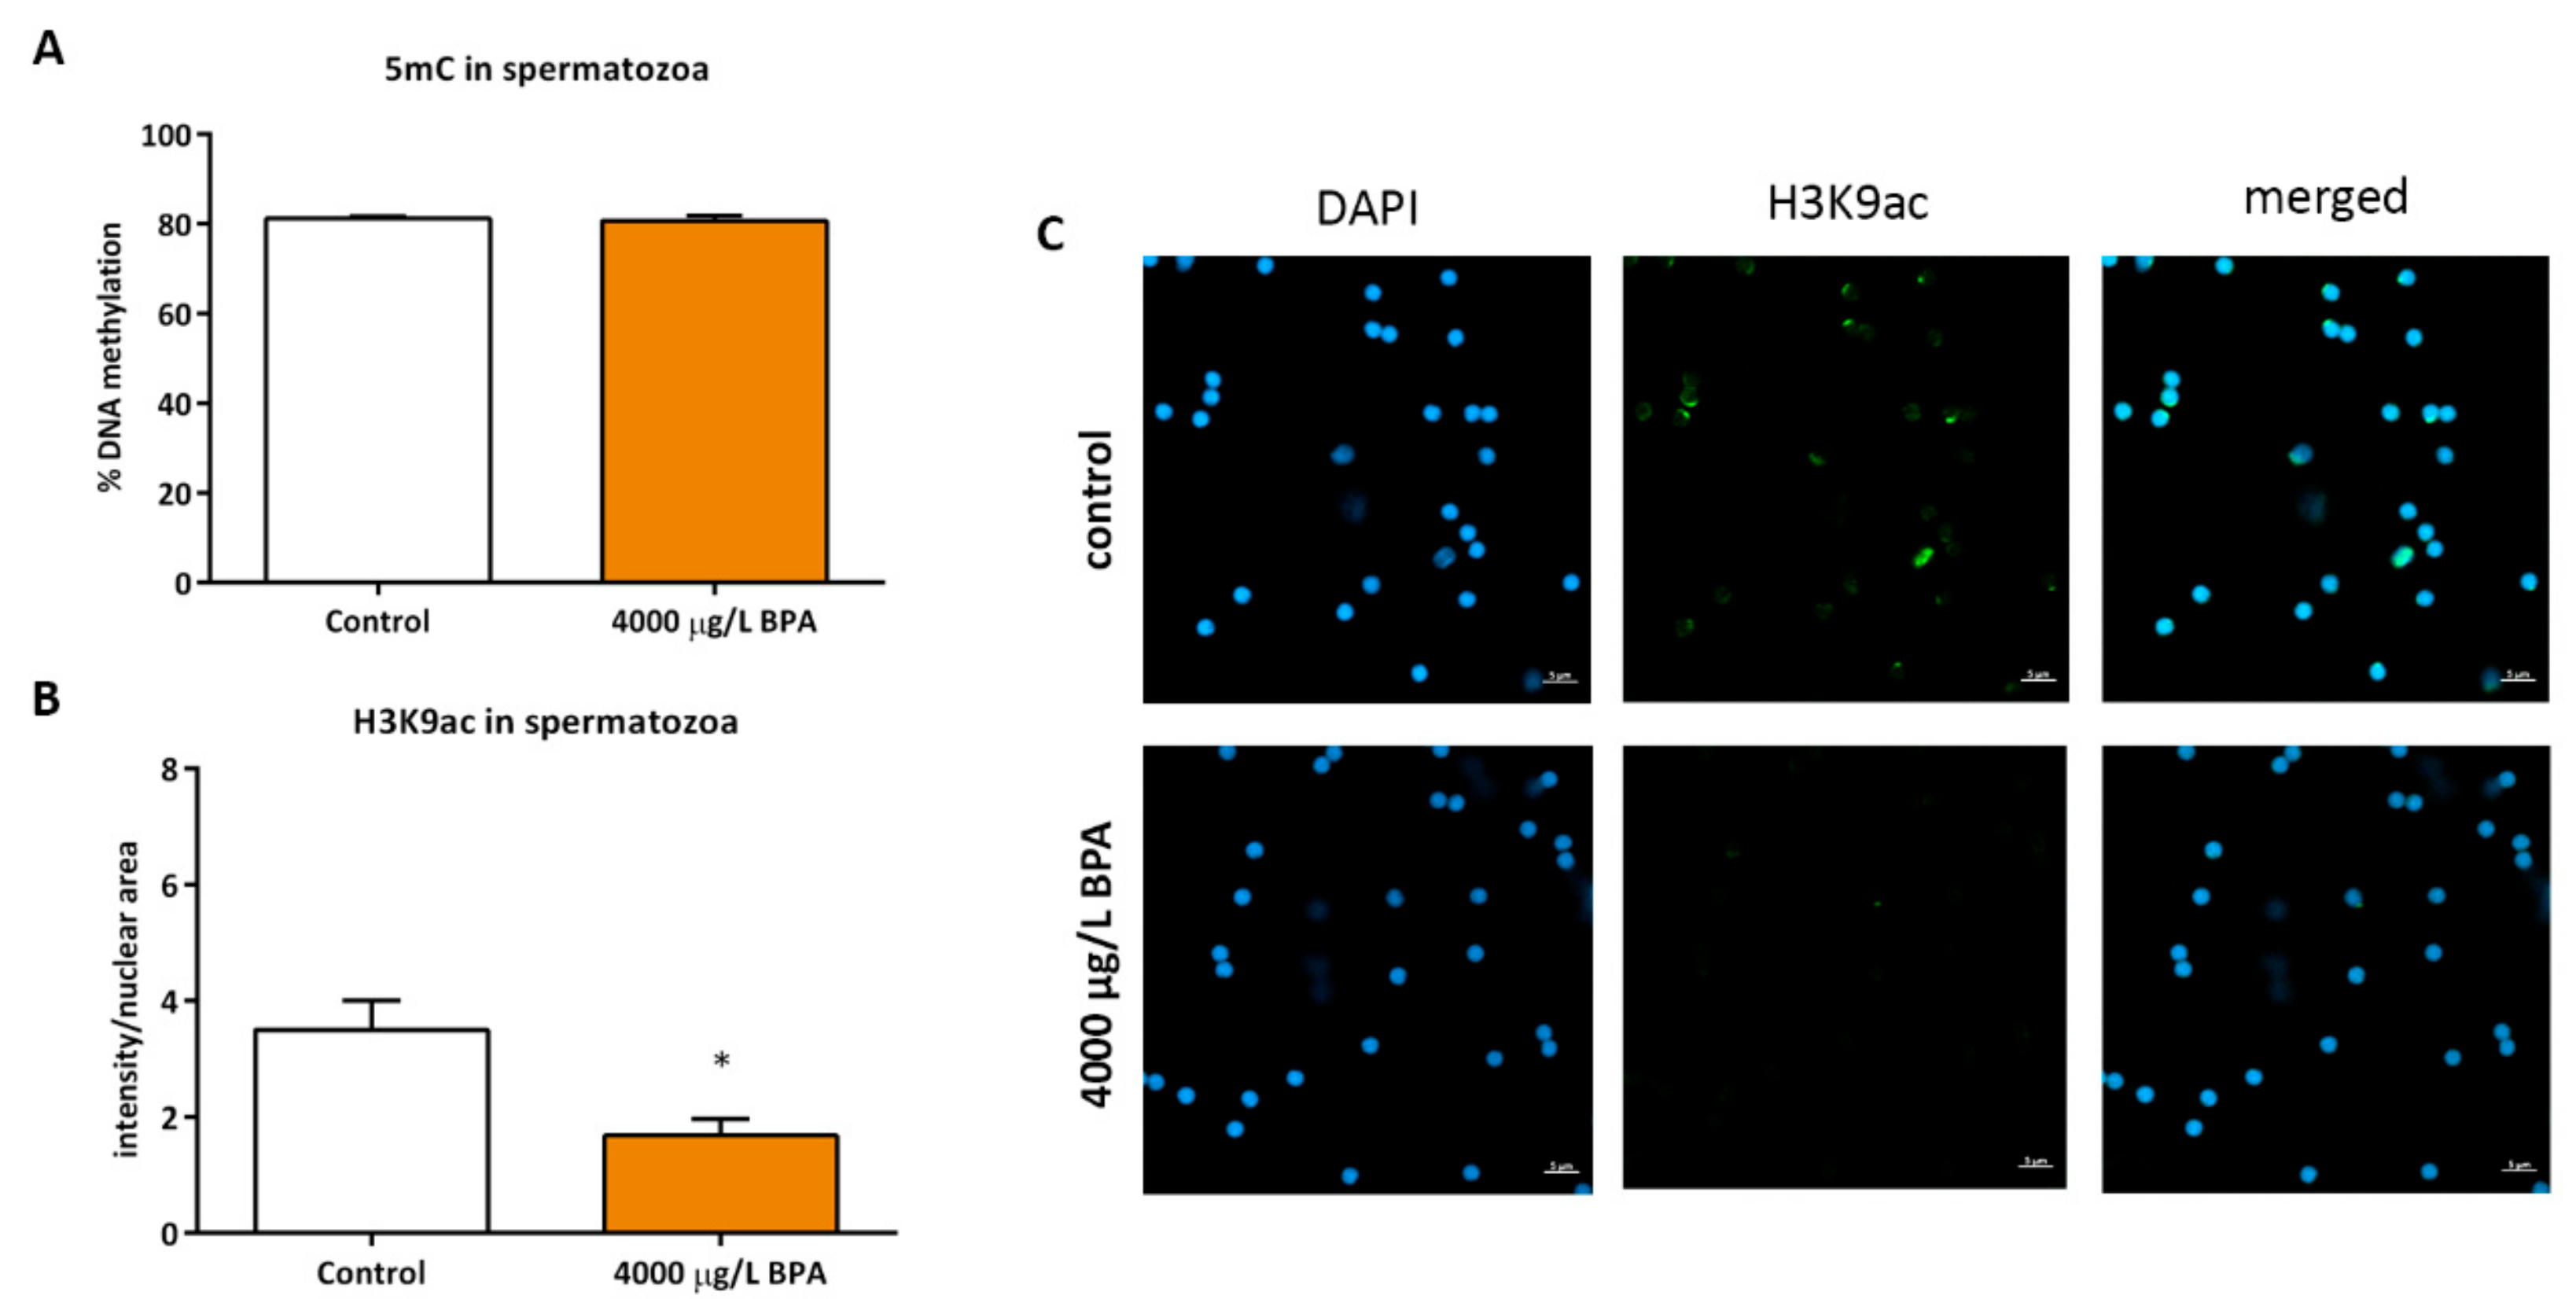
Fig. 4
Epigenetic profile of spermatozoa. (A) bars represent the percentage of global DNA methylation in spermatozoa of 3 pools of sperm from 5 control and 5 exposed fish each (n= 3). (B) bars represent the intensity of H3K9ac labelled with AlexaFluor®488 of 3 pools of sperm from 5 control and 5 exposed fish (n = 3); asterisks indicate significant differences (p < 0.05) when compared to control males. (C) confocal images of H3K9ac in spermatic nuclei (stained with DAPI); scale bar 5 µm.
Acknowledgments
This image is the copyrighted work of the attributed author or publisher, and
ZFIN has permission only to display this image to its users.
Additional permissions should be obtained from the applicable author or publisher of the image.
Full text @ Biomolecules