
Image
|
Figure Caption
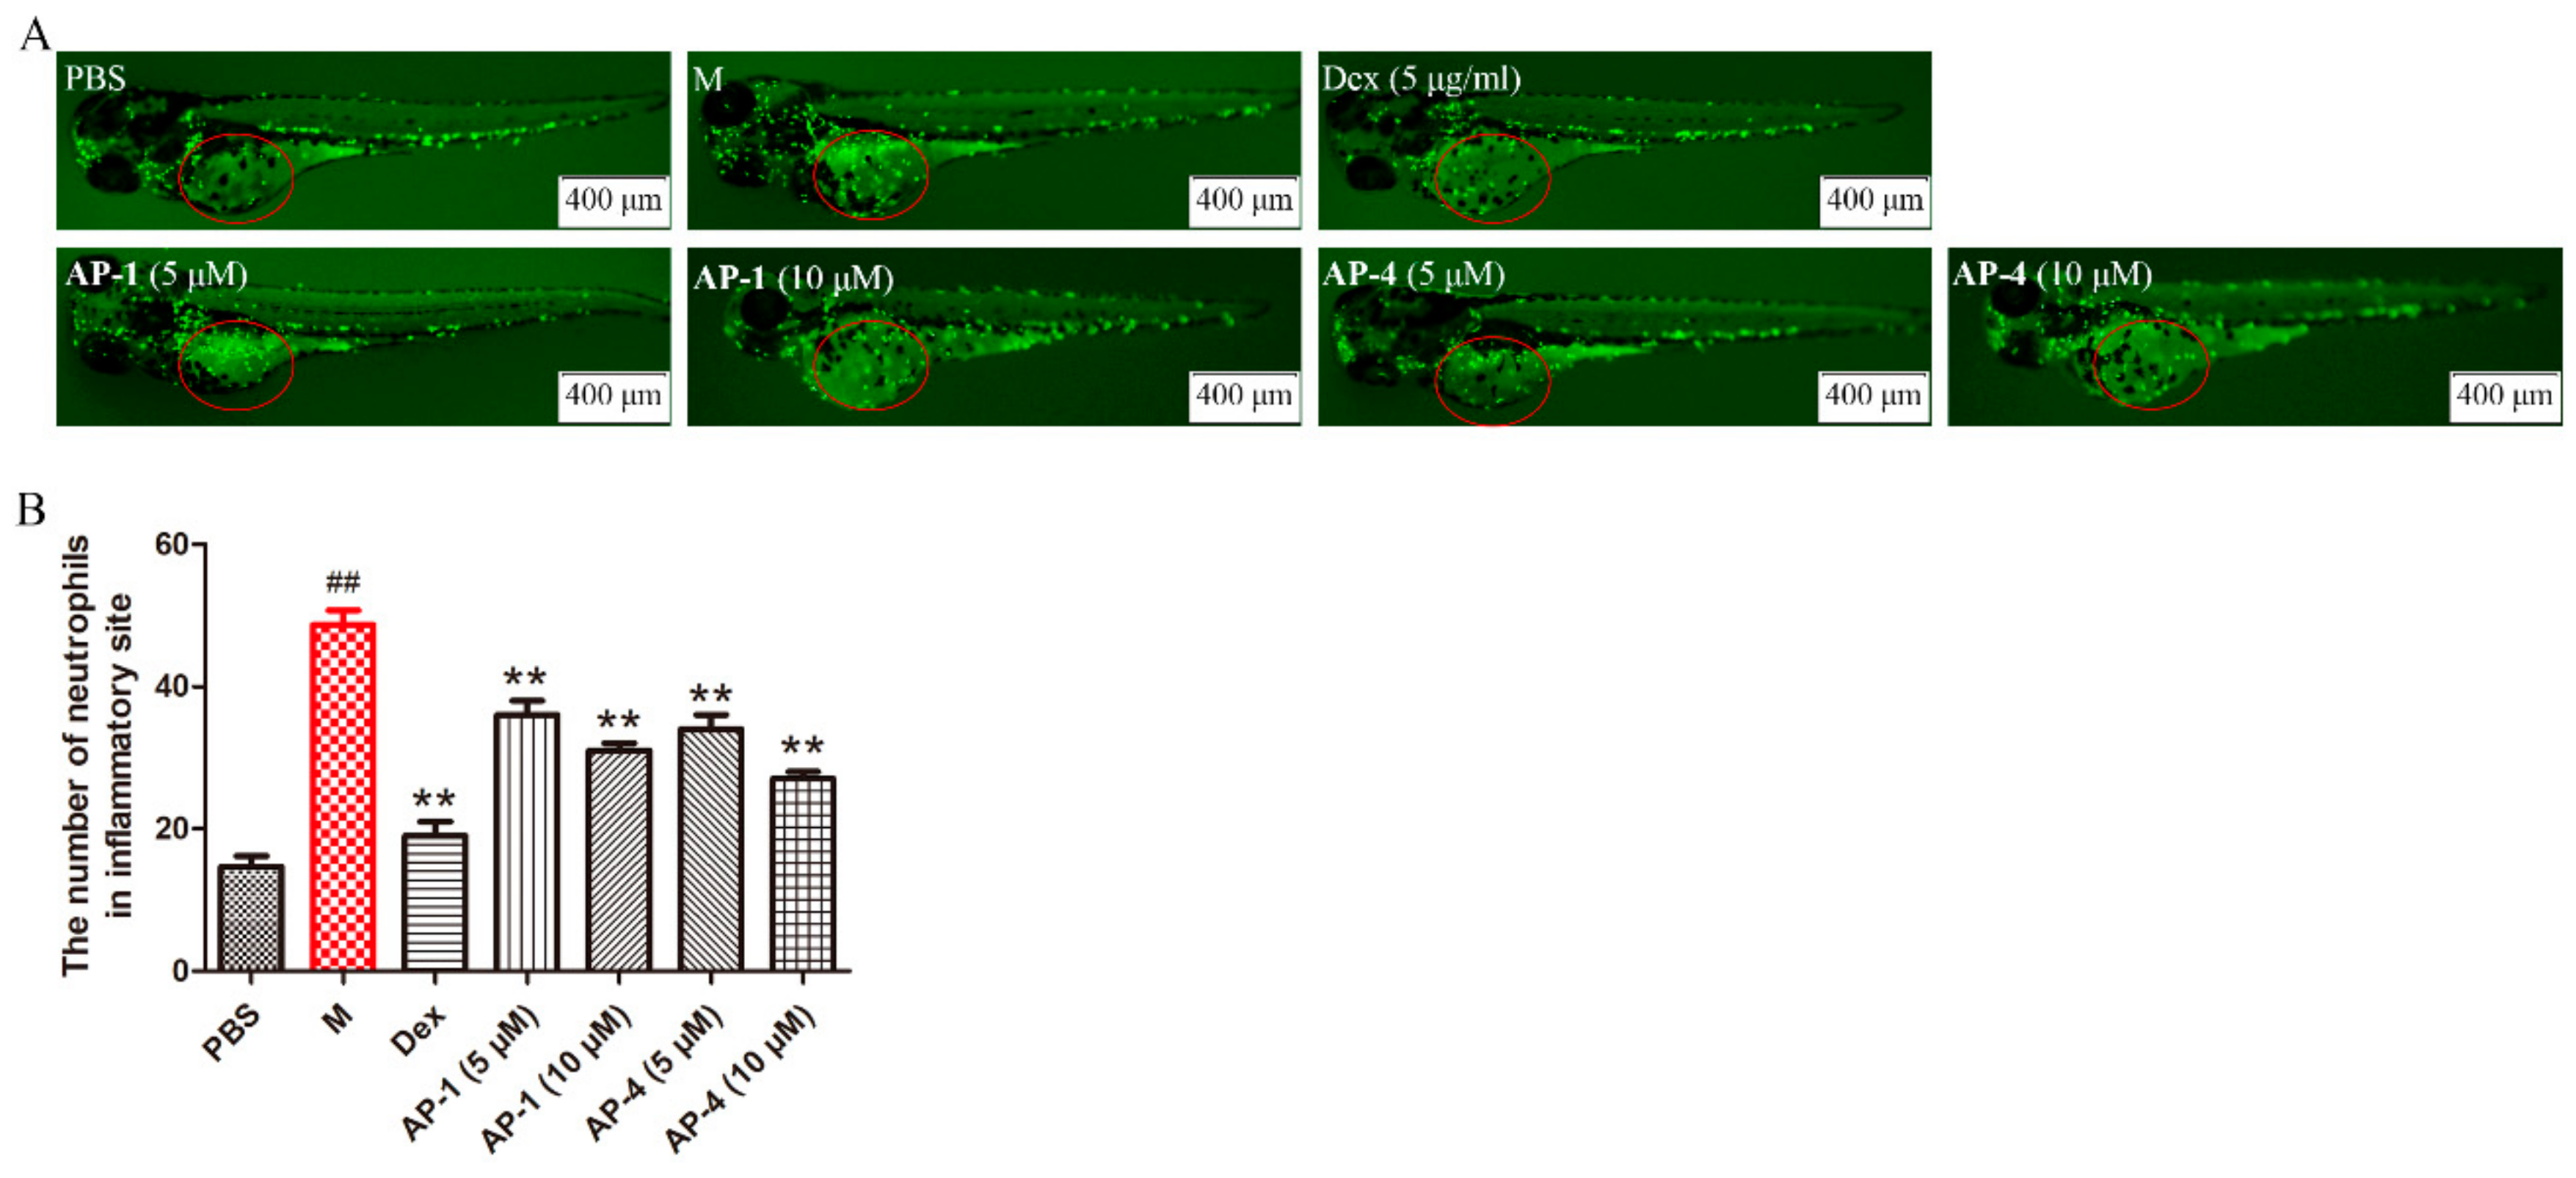
Fig. 12
AP-1 and AP-4 alleviated the inflammatory response in zebrafish subjected to LPS microinjection. (A) Representative images of zebrafish in LPS-induced inflammation model. (B) Neutrophils in the region of interest (red circles) were quantitatively analyzed. Data are represented as the mean ± SE of three independent experiments. ## p< 0.01 versus control group, ** p < 0.01 and * p < 0.05 versus model group by one-way ANOVA with Tukey’s test.
Acknowledgments
This image is the copyrighted work of the attributed author or publisher, and
ZFIN has permission only to display this image to its users.
Additional permissions should be obtained from the applicable author or publisher of the image.
Full text @ Molecules