
Fig. 1
- ID
- ZDB-IMAGE-190821-35
- Publication
- Helker et al., 2019 - Whole organism small molecule screen identifies novel regulators of pancreatic endocrine development
- All Figures
- Figures for Helker et al., 2019
|
Fig. 1
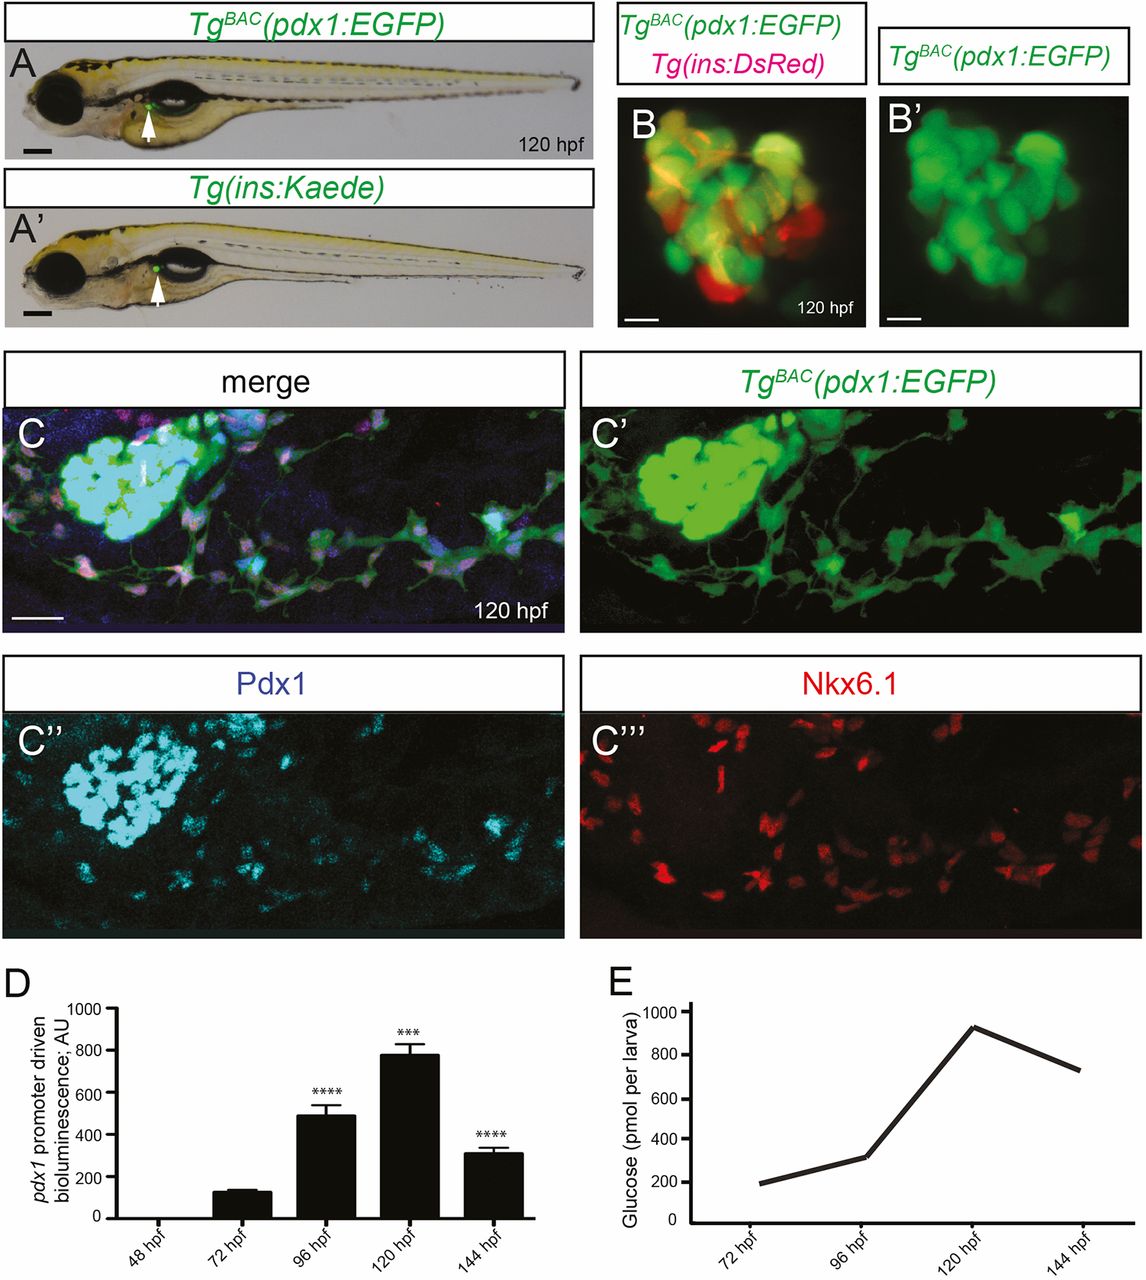
pdx1 expression in β-cells and ductal cells. (A,A′) Visualization of TgBAC(pdx1:EGFP)expression. A 200 kb pdx1 BAC drives EGFP expression specifically in the pancreatic islet (arrows). Pancreatic β-cell-specific reporter signal in Tg(ins:Kaede) larva is shown for comparison. (B,B′) Confocal images of the pancreatic islet of a 120 hpf TgBAC(pdx1:EGFP); Tg(ins:DsRed) larva showing β-cell TgBAC(pdx1:EGFP) expression. (C-C‴) Confocal images of the pancreas of a 120 hpf TgBAC(pdx1:EGFP) larva immunostained for GFP, Pdx1 and Nkx6.1 showing colocalization of TgBAC(pdx1:EGFP) expression with endogenous Pdx1. (D) Dynamics of pdx1promoter activity over time as measured by TgBAC(pdx1:luciferase) activity. The TgBAC(pdx1:luciferase) signal starts to become detectable at 72 hpf, peaks at 120 hpf and decreases by 144 hpf. (E) At the peak of the TgBAC(pdx1:luciferase) signal, whole-body free-glucose levels start to decrease, indicating β-cell function. AU, arbitrary units. ***P≤0.001, ****P≤0.0001. Error bars represent s.e.m. Scale bars: 200 µm (A); 8 µm (B,B′); 20 µm (C).