
IMAGE
Fig. S7
- ID
- ZDB-IMAGE-190820-67
- Publication
- Adeyemo et al., 2019 - ZRANB3 is an African-specific type 2 diabetes locus associated with beta-cell mass and insulin response
- All Figures
- Figures for Adeyemo et al., 2019
Image
|
Figure Caption
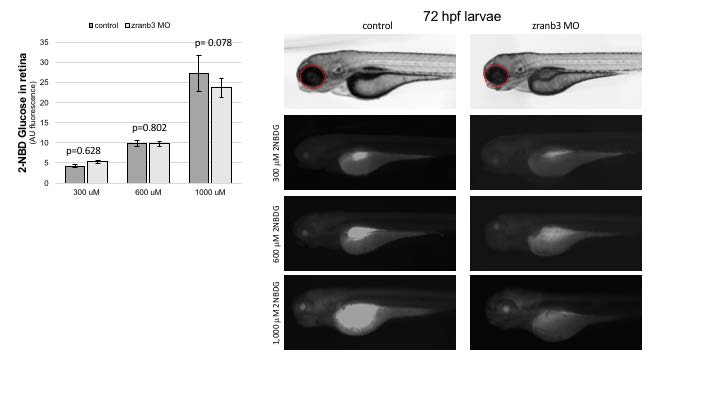
Fig. S7
Glucose uptake as determined by retinal fluorescence after 2-NBDG treatment. (A) Quantification of glucose uptake at various concentrations in wild-type and zranb3 MO-injected larvae by quantification of 2-NBDG fluorescence. (B) Fluorescent 2-NBDG staining in control (left panel) and zranb3 MO-injected (right panel) larvae
Figure Data
Acknowledgments
This image is the copyrighted work of the attributed author or publisher, and
ZFIN has permission only to display this image to its users.
Additional permissions should be obtained from the applicable author or publisher of the image.
Full text @ Nat. Commun.