
Fig. S4
- ID
- ZDB-IMAGE-190816-25
- Publication
- Rho et al., 2019 - Rap1b Promotes Notch-Signal-Mediated Hematopoietic Stem Cell Development by Enhancing Integrin-Mediated Cell Adhesion
- All Figures
- Figures for Rho et al., 2019
|
Fig. S4
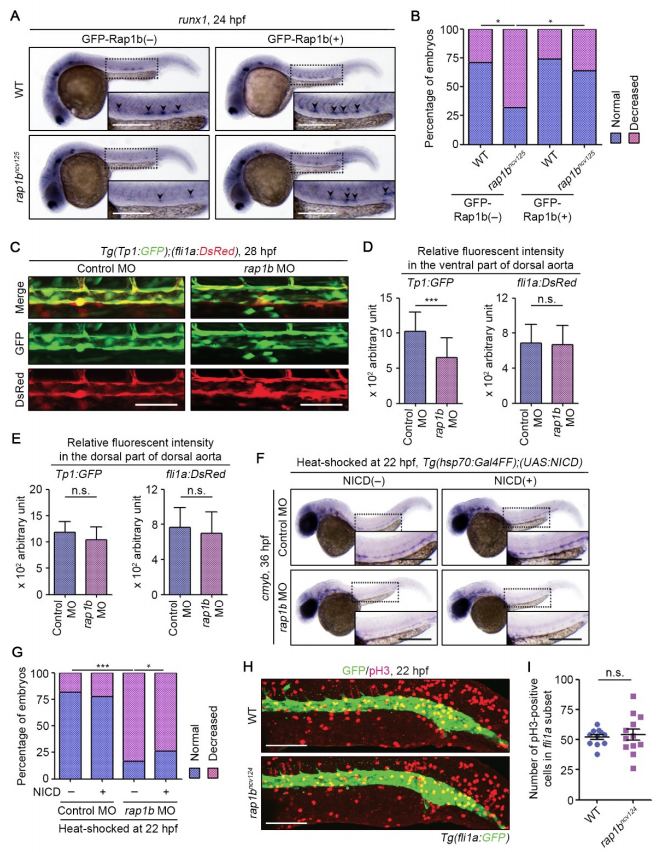
Rap1b Regulates HE Specification through Notch Signaling in a Cell-Autonomous Manner, Related to Figure 3. (A) Expression patterns of HE marker runx1 in 24 hpf sibling (WT, upper) and rap1bncv125 (lower) embryos crossed without (GFP-Rap1b(‒), left column) or with (GFP-Rap1b(+), right column) Tg(fli1a:GFP-rap1b). The boxed areas are enlarged in 9 the insets. Arrowheads indicate runx1-positive hemogenic ECs. (B) Percentage of embryos showing normal (3 or more, blue) and decreased (less than 3, pink) number of runx1-positive hemogenic ECs in the AGM regions as observed in (A). WT+GFP-Rap1b(‒), n=21; rap1bncv125+GFP-Rap1b(‒), n=25; WT+GFP-Rap1b(+), n=24; rap1bncv125+GFP-Rap1b(+), n=26. **, p < 0.01; *, p < 0.05. (C) Confocal stack fluorescence images of dorsal aorta in 28 hpf Tg(Tp1:GFP);(fli1a:DsRed) embryos injected with control MO (left column) and rap1b MO (right column). Dorsal view with anterior to the left. Upper, merged images of GFP (green) and DsRed (red); middle, GFP images; lower, DsRed images. (D, E) Relative fluorescence intensity of Tp1:GFP (left graph) and fli1a:DsRed (right graph) in the ventral (D) and dorsal (E) parts of dorsal aorta, as observed in (C). Data are means ± s.d. Control MO, n=16; rap1b MO, n=16. ***, p < 0.001; n.s., not significant. (F) Expression patterns of cmyb in 36 hpf control MO- and rap1b MO-injected embryos heat shocked at 22 hpf for 45 min with either wild type or the Tg(hsp70:Gal4FF) background (NICD(‒), left column) and with the Tg(hsp70:Gal4FF);(UAS:NICD) background (NICD(+), right column). (G) Percentages of embryos showing normal (blue) and decreased (pink) expressions of cmyb in the AGM regions of embryos heat shocked at 22 hpf, as observed in (F). Control MO/NICD(‒), n=22; rap1b MO/NICD(‒), n=30; Control MO/NICD(+), n=18; rap1b MO/NICD(+), n=19. *, p < 0.05; **, p < 0.01; ***, p < 0.001. (H) Confocal stack fluorescence images of trunk and tail regions of 22 hpf wild type and rap1bncv124 embryos immunostained with anti-GFP (green) and anti-phospho-histone H3 (red) antibodies. Dorsal views with anterior to the left. (I) Number of phospho-histone H3-positive cells within the fli1a:GFP-labeled vascular cord, as observed in (F). Each dot represents the value of individual cells. Error bars indicate means ± s.d. WT, n=11; rap1bncv124, n=12. n.s., not significant. Scale bars: 200 μm (A, F); 50 μm (C); 100 μm (H).
Reprinted from Developmental Cell, 49(5), Rho, S.S., Kobayashi, I., Oguri-Nakamura, E., Ando, K., Fujiwara, M., Kamimura, N., Hirata, H., Iida, A., Iwai, Y., Mochizuki, N., Fukuhara, S., Rap1b Promotes Notch-Signal-Mediated Hematopoietic Stem Cell Development by Enhancing Integrin-Mediated Cell Adhesion, 681-696.e6, Copyright (2019) with permission from Elsevier. Full text @ Dev. Cell