
Image
|
Figure Caption
Fig. 2
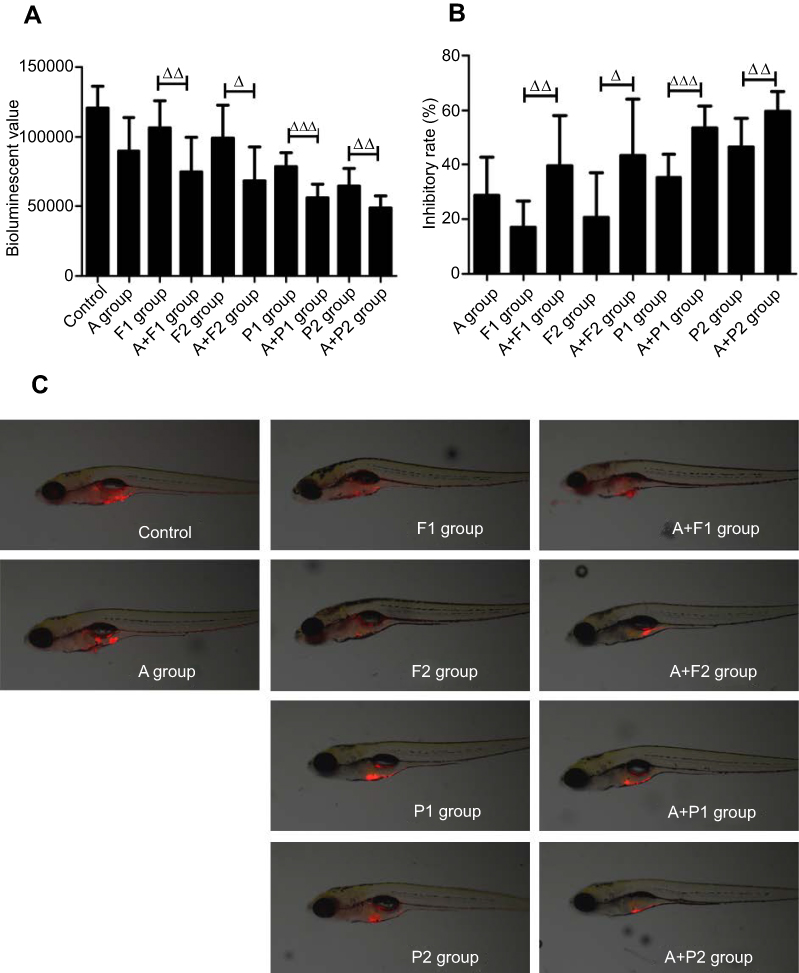
Effect of apatinib on cytotoxicity of PTX and 5-Fu in zebrafish. (A) Comparison of bioluminescent signals between groups. (B) Inhibitory rate of every group. (C) Tumor sizes in zebrafish evaluated by fluorescence microscopy. △, p<0.05; △△, p<0.01; △△△, p<0.001.Abbreviations: A, apatinib; 5-Fu, 5-fluorouracil; F1, 25 ng/fish 5-Fu; F2, F2, 50ng/fish 5-Fu; P1, 0.75 ng/fish PTX; P2, 1.5 ng/fish PTX; PTX, paclitaxel.
Figure Data
Acknowledgments
This image is the copyrighted work of the attributed author or publisher, and
ZFIN has permission only to display this image to its users.
Additional permissions should be obtained from the applicable author or publisher of the image.
Full text @ Cancer Manag Res