
Fig. 4-S1
- ID
- ZDB-IMAGE-190815-45
- Publication
- Miskolci et al., 2019 - Distinct inflammatory and wound healing responses to complex caudal fin injuries of larval zebrafish
- All Figures
- Figures for Miskolci et al., 2019
|
Fig. 4-S1
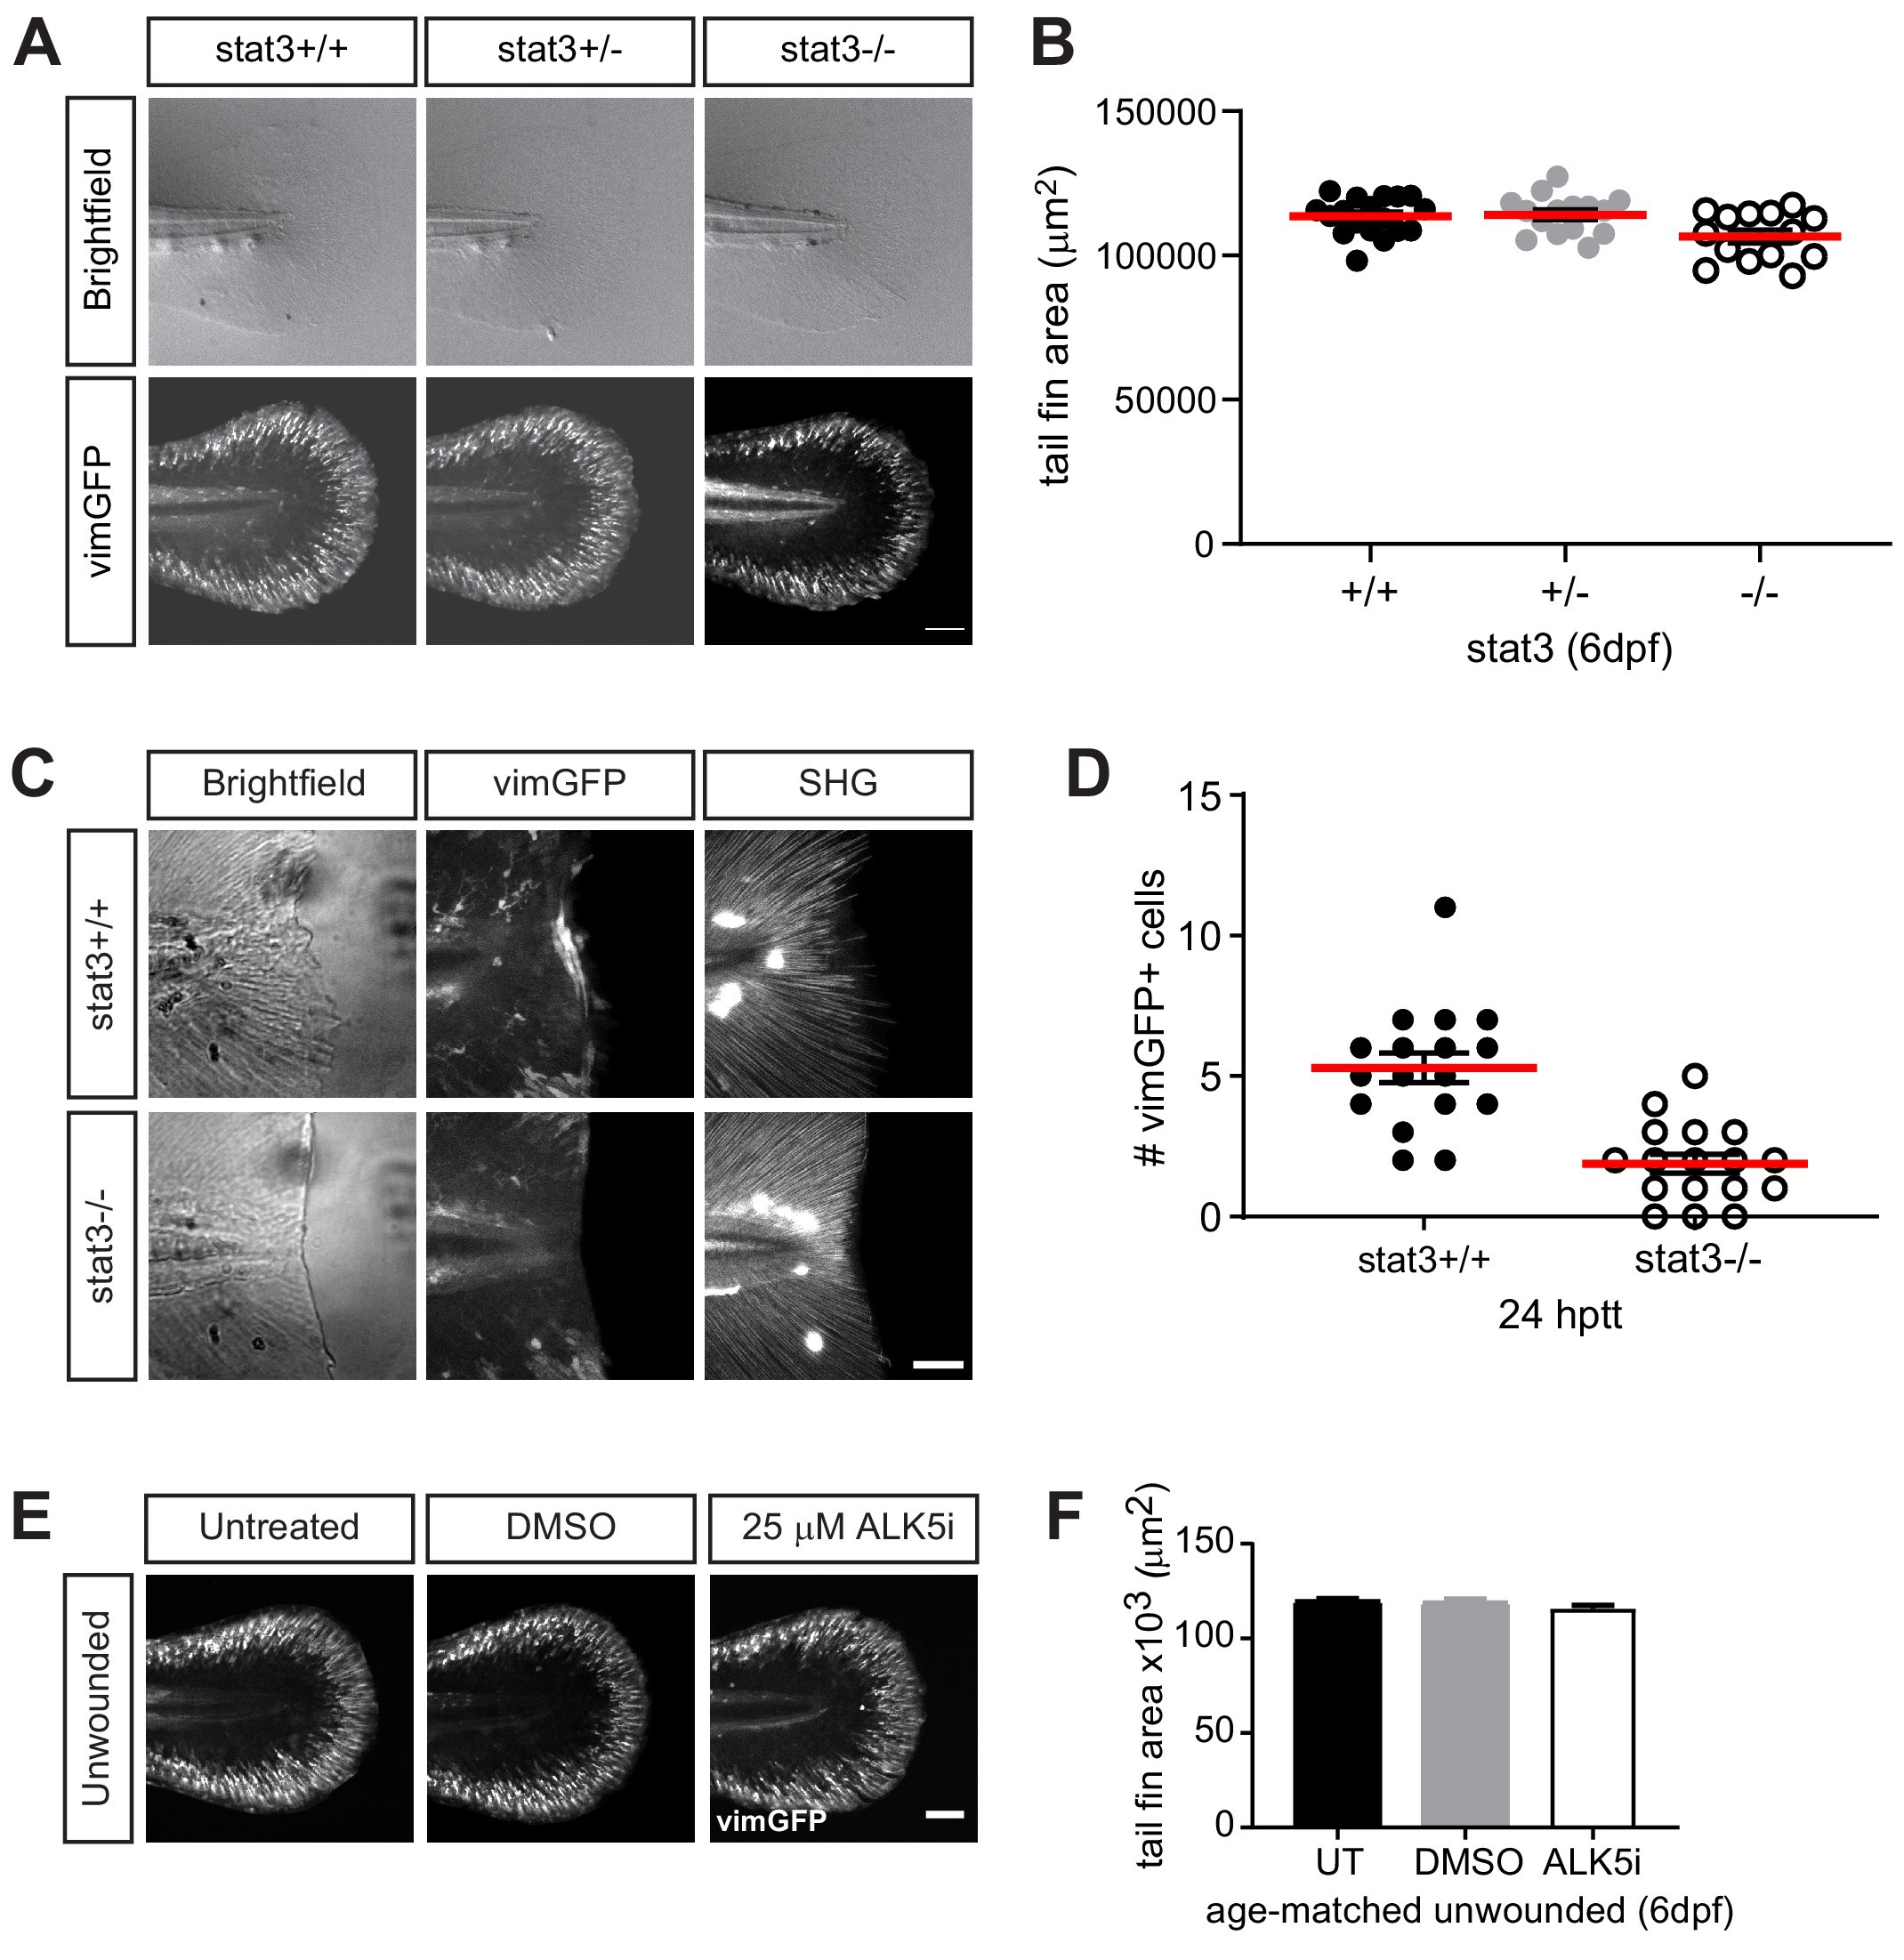
Stat3 or TGFβ signaling does not affect the presence of vimGFP-positive cells associated with development.
(A) Sum-projections of z-stacks acquired by spinning disk confocal microscope using Tg(vim:GFP) larvae in stat3 mutant background, showing tail fin of age-matched unwounded larvae at 6 dpf. Scale bar is 100 microns. (B) the corresponding quantification of the tail fin area. Total N = 47 larvae from het incross; one biological replicate, thus no statistical analysis was performed. (C) z-projections acquired by multiphoton microscropy using Tg(vim:GFP) larvae in stat3 mutant background, showing vimentin-expressing cells and SHG fiber organization in caudal fins at 24 hptt. Scale bar is 50 microns. (D) the corresponding quantification of vimentin-positive cells at the wound edge. Total N = 17 larvae per genotype; two biological replicates, thus no statistical analysis performed. (E) Sum-projections of z-stacks acquired by spinning disk confocal microscope using Tg(vim:GFP) larvae, showing tail fin area and vimentin-expressing cells of unwounded larvae at 6 dpf in E3 medium only (untreated, UT) or in the presence of 25 µM ALK5 (TGFβRI) inhibitor or 0.5% DMSO as vehicle control. Scale bar is 100 microns. (F) the corresponding quantification of tail fin area in unwounded larvae. Values are arithmetic mean and SE from three biological replicates. No statistically significant differences were detected. Total N = 36–39 for each treatment.