
Image
|
Figure Caption
Fig. 2
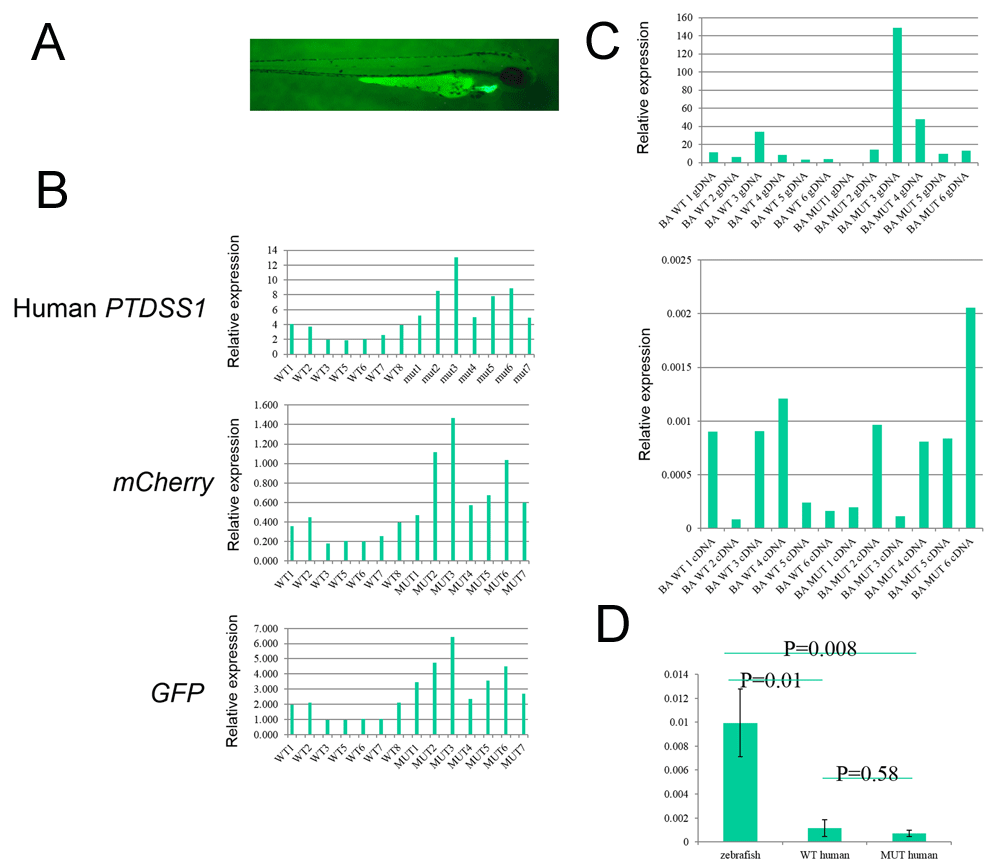
A) Example of a zebrafish with a GFP positive heart. B) Copy number analysis of integrated human PTDSS1, GFP and mCherry by q-PCR on gDNA isolated from individual GFP- fluorescing zebrafish. C) Comparison of DNA copy number (top panel) and RTq-PCR expression analysis (bottom panel) for individual zebrafish where DNA and RNA were extracted from the same samples. D) Comparison of endogenous zebrafish ptdss1 with human PTDSS1 showing significantly higher levels of endogenous transcripts over WT and mutant transgene transcripts (p=0.01 and 0.008 respectively).Expression analysis in transgenic zebrafish.
Acknowledgments
This image is the copyrighted work of the attributed author or publisher, and
ZFIN has permission only to display this image to its users.
Additional permissions should be obtained from the applicable author or publisher of the image.
Full text @ F1000Res