
Fig. S1
- ID
- ZDB-IMAGE-190814-3
- Publication
- Lin et al., 2019 - An Ectoderm-Derived Myeloid-like Cell Population Functions as Antigen Transporters for Langerhans Cells in Zebrafish Epidermis
- All Figures
- Figures for Lin et al., 2019
|
Fig. S1
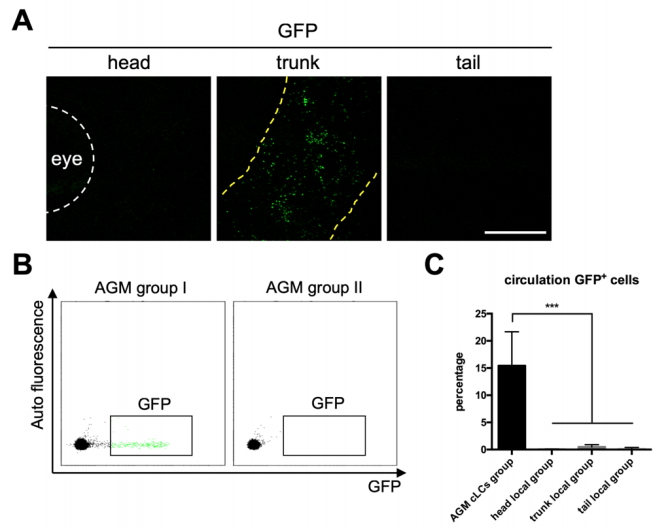
Fish with locally restricted mpeg1+ cells lack GFP+ cells in circulation. Related to Figure 1 (A) Low magnification images show the distribution of locally restricted mpeg1+ cells in group II fish. Yellow dash lines indicate the boundary of GFP+ cells. Scale bar, 1 mm. (B) FACS analysis indicates that GFP+ cells are present in the circulation of group I fish with universally distributed mpeg1+ cells but not in group II fish with locally restricted mpeg1+ cells. (C) The percentage of GFP+ cells in total circulating mpeg1+ cells in AGMirradiated group I adult fish (n=4), dorsal head region-irradiated adult fish (n=4), dorsal trunk region-irradiated adult fish (n=4) and dorsal tail region-irradiated adult fish (n=4). Data are represented as mean ± SD, ***P<0.001.
Reprinted from Developmental Cell, 49(4), Lin, X., Zhou, Q., Zhao, C., Lin, G., Xu, J., Wen, Z., An Ectoderm-Derived Myeloid-like Cell Population Functions as Antigen Transporters for Langerhans Cells in Zebrafish Epidermis, 605-617.e5, Copyright (2019) with permission from Elsevier. Full text @ Dev. Cell