
|
Fig. 7
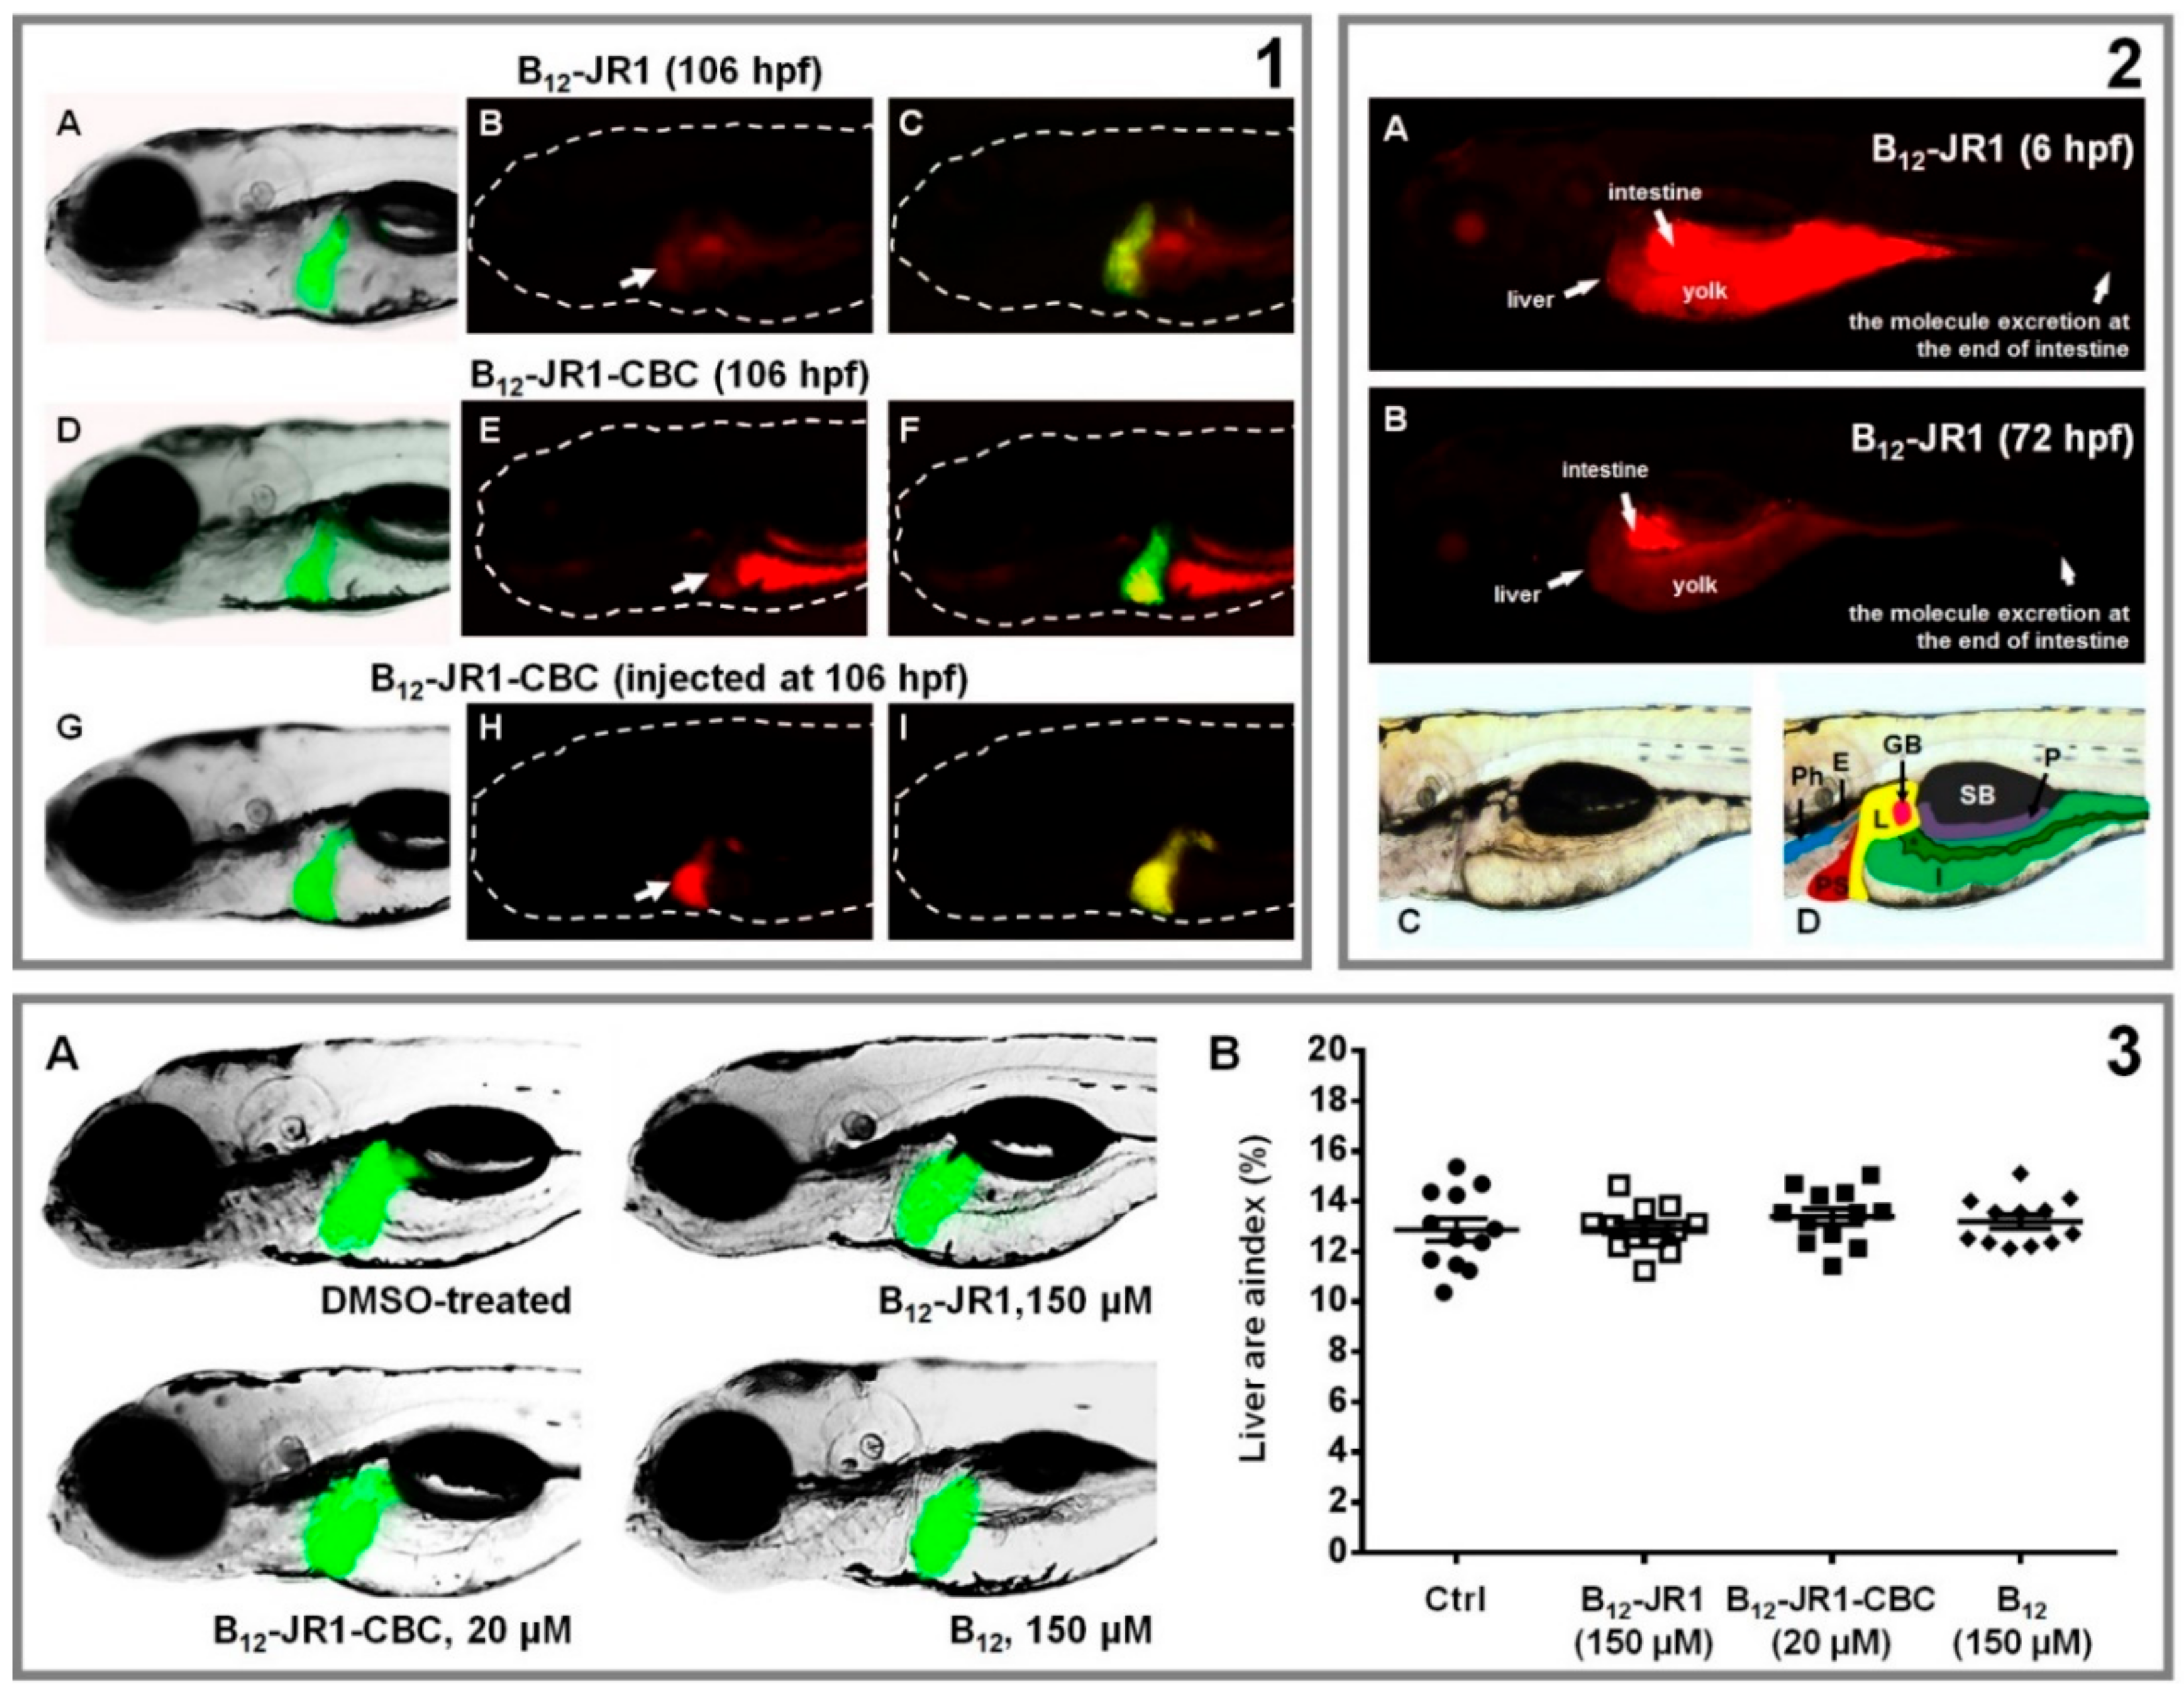
<p>Bio-distribution and toxicity evaluation of B<sub>12</sub>-JR1 and B<sub>12</sub>-JR1-CBC in the 120-hpf old transgenic Tg(fabp10:EGFP) zebrafish embryo with fluorescently labelled liver. Panel 1 (top left). Top: accumulation of B<sub>12</sub>-JR1 (150 µM) in the liver applied at 106 hpf in the embryo water. (A) Embryo imaged by a fluorescent microscope with a filter enabling only EGFP-labelled liver visualization. (B) Embryo imaged with a filter enabling B<sub>12</sub>-JR1 visualization, but not EGFP-labelled liver. (C) Merged images A and B. Middle: accumulation of B<sub>12</sub>-JR1-CBC (20 µM) in the liver applied at 106 hpf in the embryo water. (D) Embryo imaged upon a filter enabling only EGFP-labelled liver visualization. (E) Embryo imaged with a filter enabling only B<sub>12</sub>-JR1 visualization, and (F) merged Tg(fabp10:EGFP) and B<sub>12</sub>-JR1-CBC fluorescent signals in the same embryo. Bottom: an accumulation of B<sub>12</sub>-JR1-CBC (47.8 µg per an embryo, corresponding to 20 µM dose) in the liver microinjected (parenteral use) into embryo’s circulation at 106 hpf. Arrows in the panel 1 indicate the liver position within embryos body. Panel 2 (top right): distribution of B<sub>12</sub>-JR1 (150 µM) within the 120-hpf old embryos when applied at 6 hpf (the liver-free stage, A) or 72 hpf (the stage with functional liver, B). Lateral views (C and D) of the 120-hpf embryo with an overlay. Overlay outlines the pharynx (Ph), esophagus (E), liver (L), gallbladder (G), pancreas (P), swimmbladder (SB), and intestine (I). * marks intestinal lumen. Panel 3 (bottom). Hepatotoxicity evaluation in the transgenic Tg(fabp10:EGFP) zebrafish embryos with EGFP-labelled liver after the embryos exposure to the tested compounds in a period from 72–120 hpf (A). The liver area index was assessed in 120-h old zebrafish embryos (B) and indicated no changes in the treated groups compared to the DMSO-treated (control) one (n = 15).</p>