
Fig. 3
- ID
- ZDB-IMAGE-190809-16
- Publication
- Feng et al., 2019 - In Vitro and In Vivo Neuroprotective Effects of Stellettin B Through Anti-Apoptosis and the Nrf2/HO-1 Pathway
- All Figures
- Figures for Feng et al., 2019
|
Fig. 3
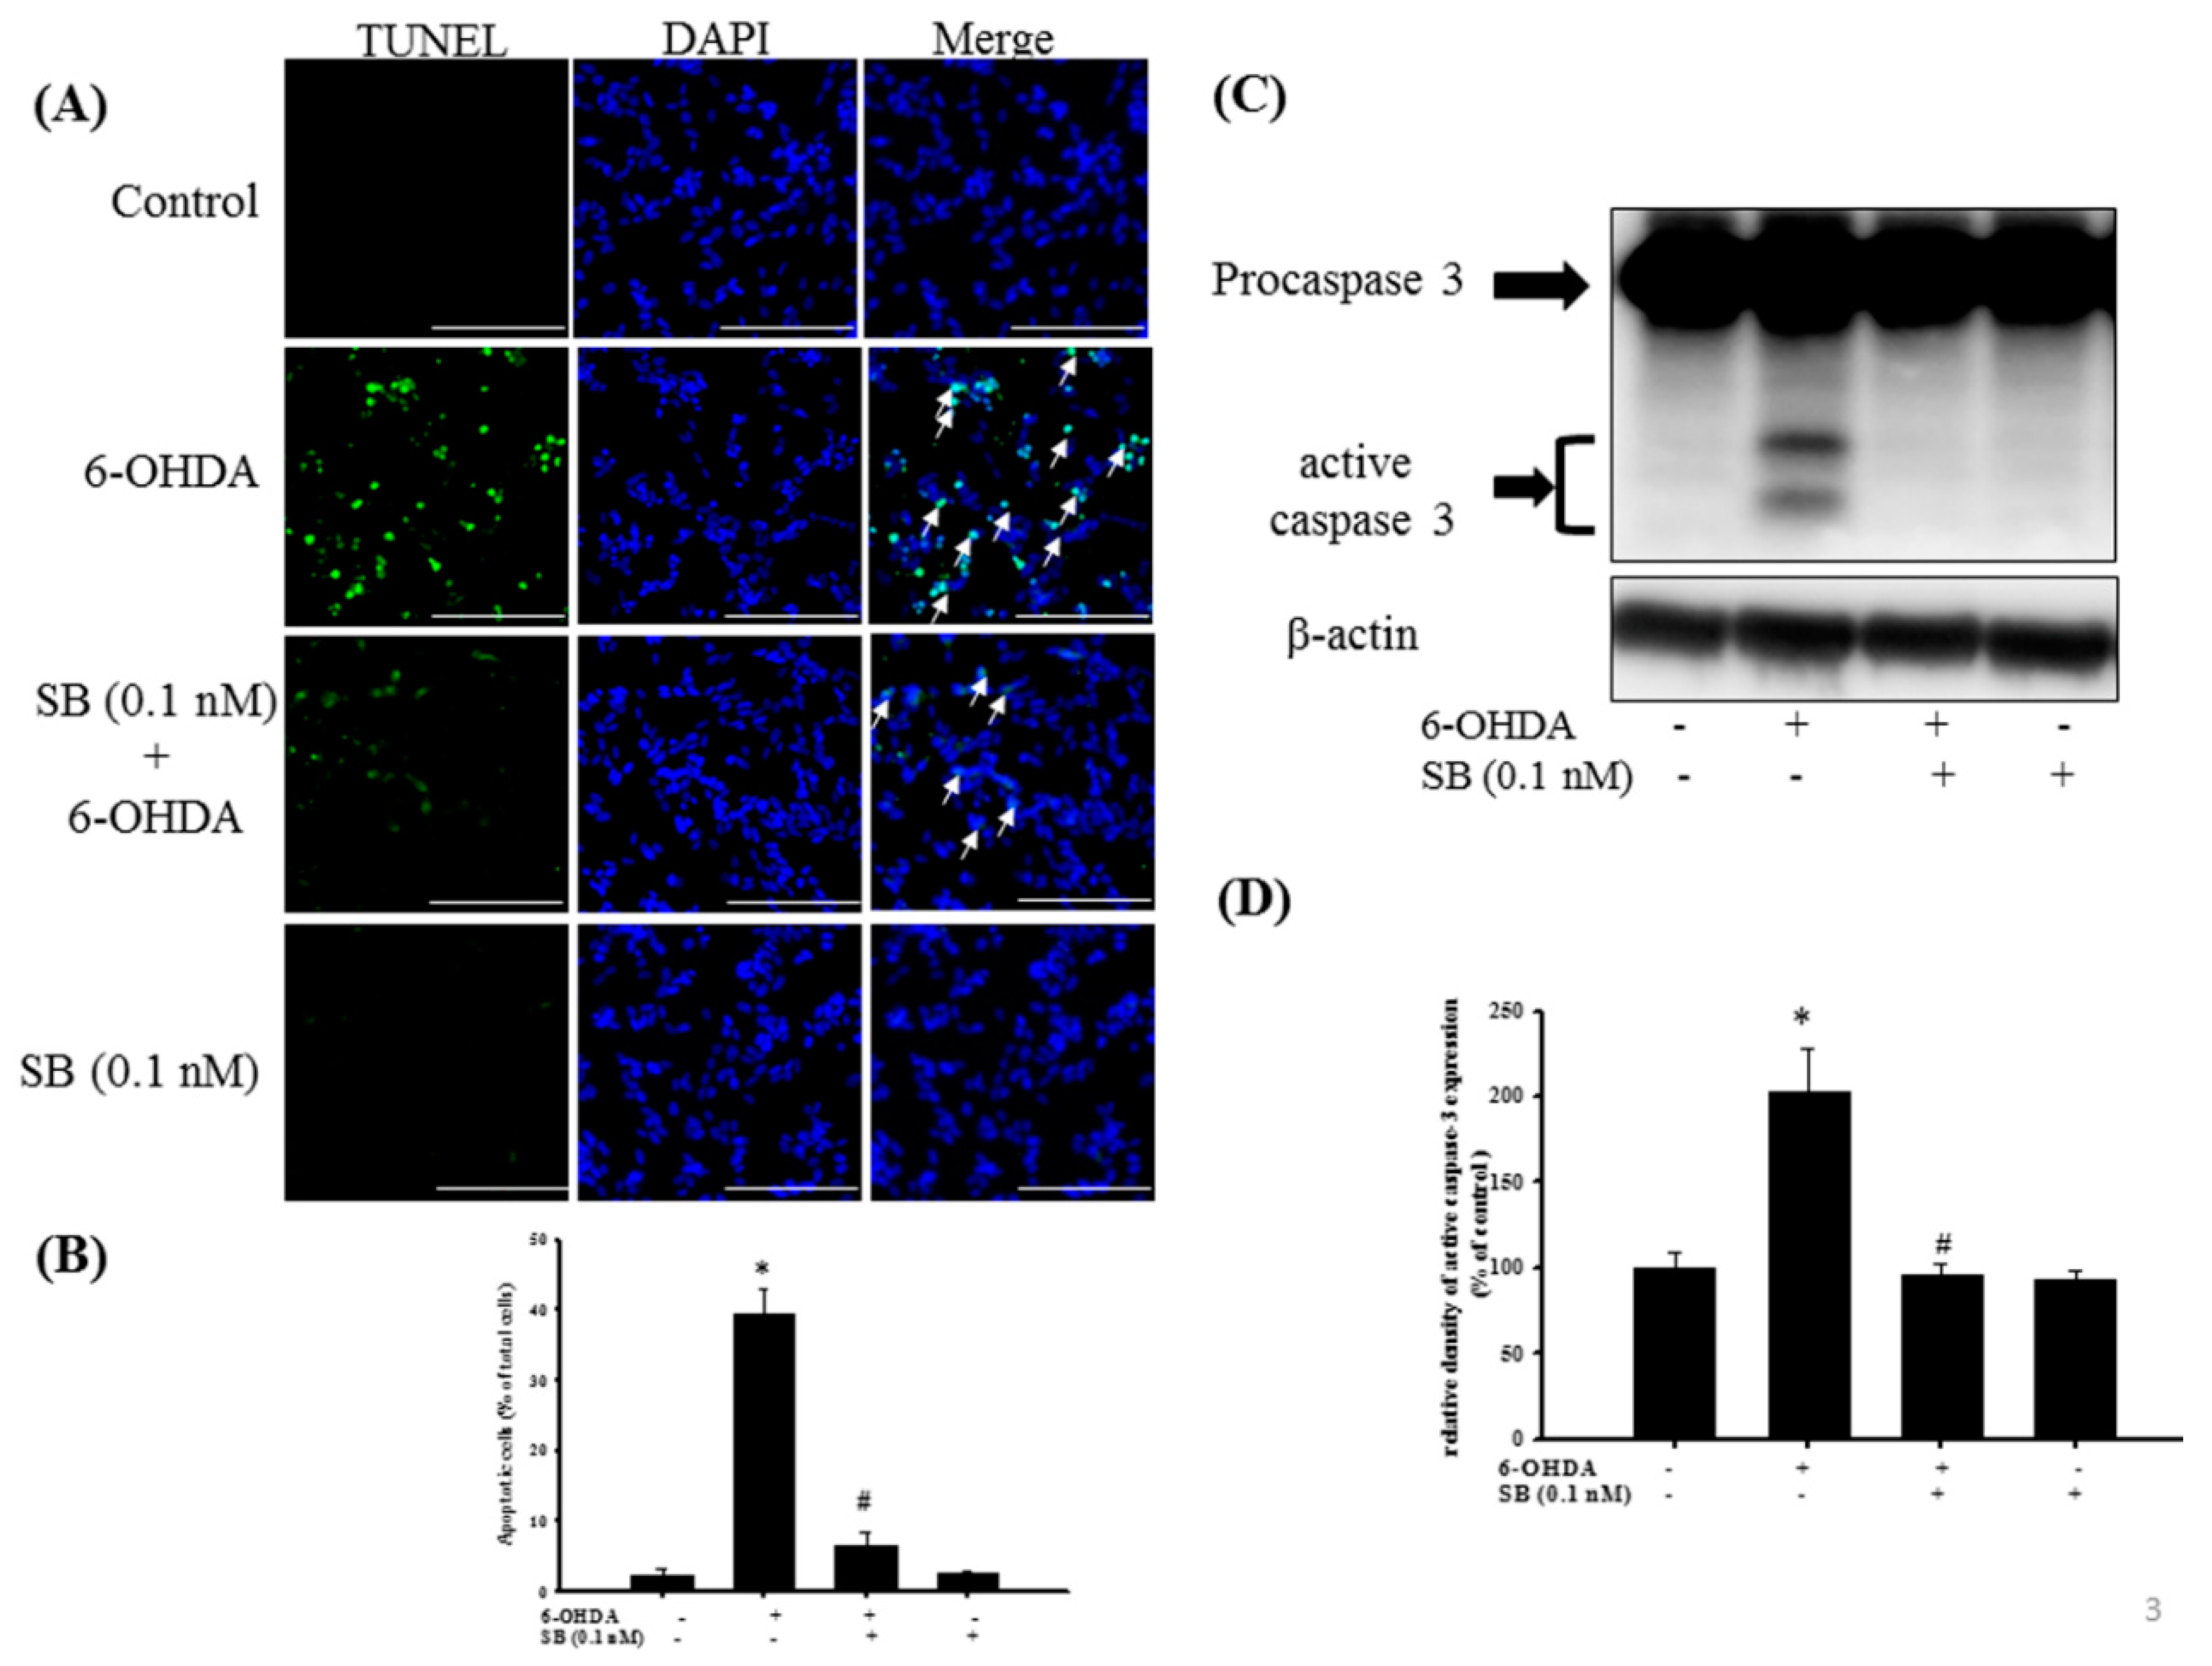
The anti-apoptotic effect of SB on 6-OHDA-induced neurotoxicity in SH-SY5Y cells: SH-SY5Y cells were pretreated with 0.1 nM SB for 1 h and then challenged with 20 μM 6-OHDA for 8 h in the control, 6-OHDA, 6-OHDA plus SB, and SB alone treatment groups. (A) TUNEL staining. White arrows indicate apoptotic cells (scale bar = 100 μM); (B) Quantification of apoptotic cells in each treatment group; (C) Western blotting showing induction of cleaved caspase-3 protein; (D) Quantification of relative density of cleaved caspase-3 protein from Western blotting. Data are presented as mean ± SEM, and each value represents the mean of three replicates and three samples. *significantly different from the control group; # significantly different from the 6-OHDA group.