
Fig. 2
- ID
- ZDB-IMAGE-190809-15
- Publication
- Feng et al., 2019 - In Vitro and In Vivo Neuroprotective Effects of Stellettin B Through Anti-Apoptosis and the Nrf2/HO-1 Pathway
- All Figures
- Figures for Feng et al., 2019
|
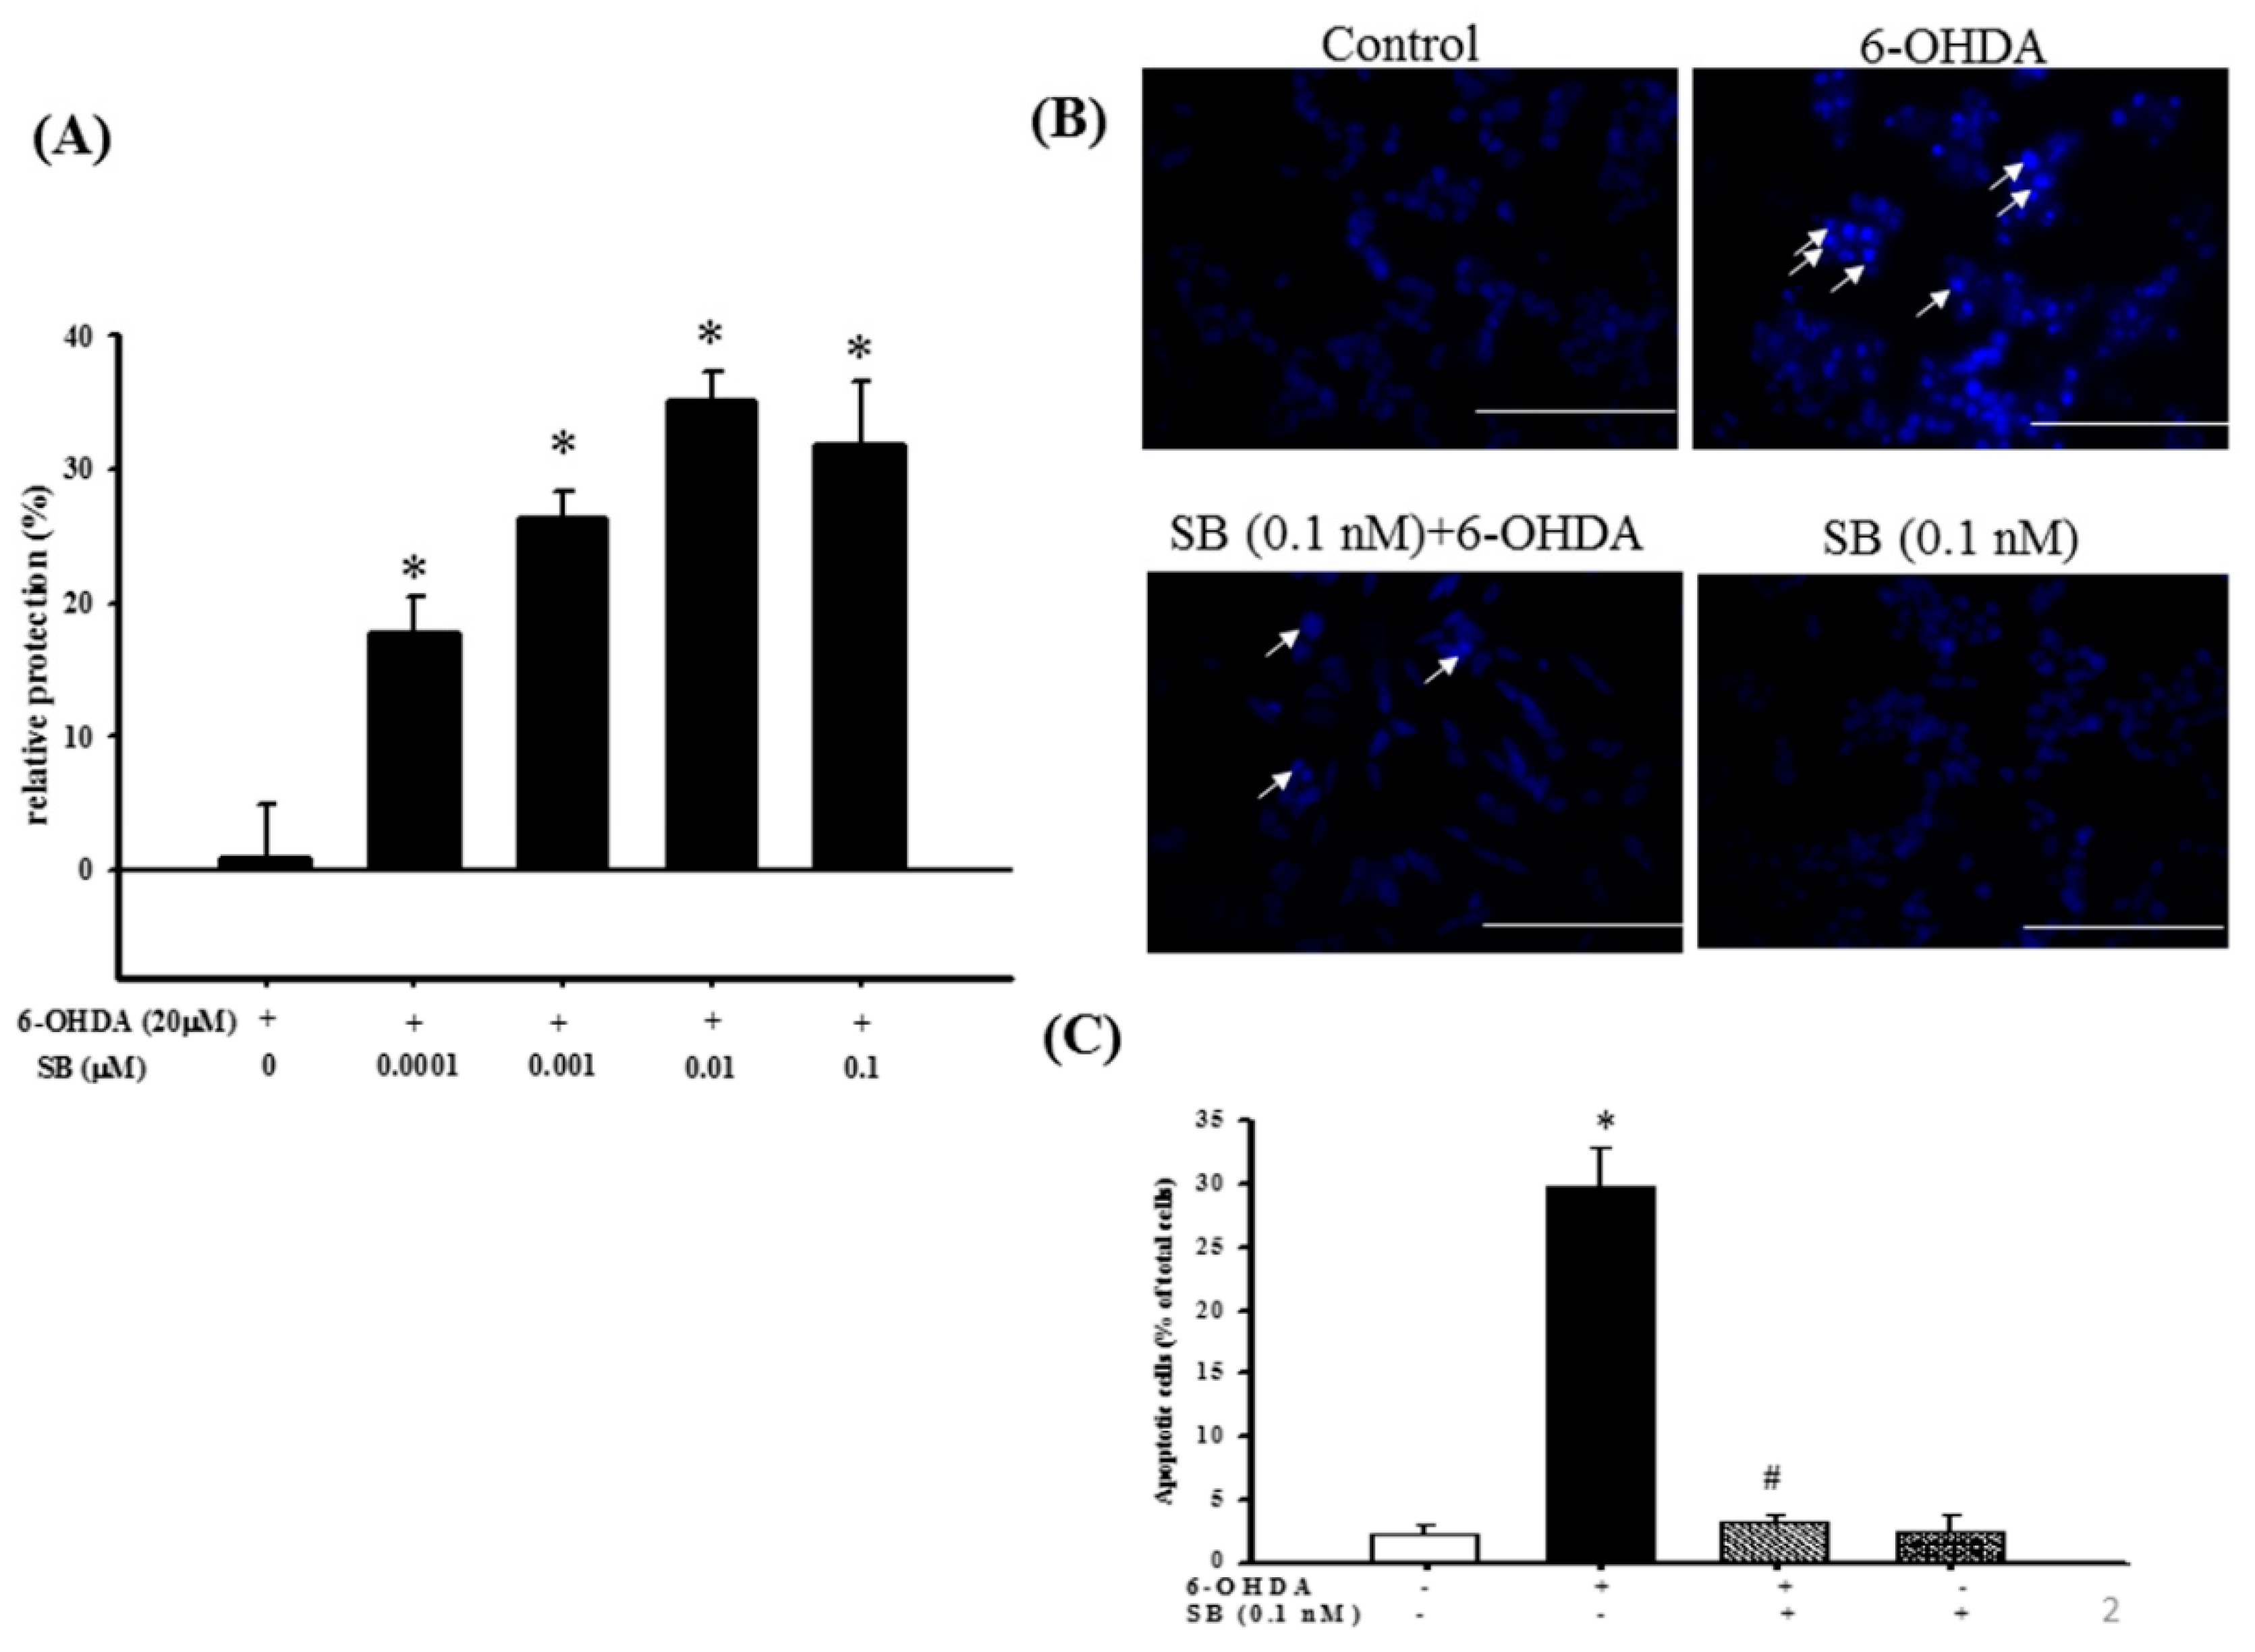
Fig. 2
Cytoprotective effect of SB against 6-OHDA damage in SH-SY5Y cells: (A) SH-SY5Y cells were pretreated with 0.1, 1, 10, or 100 nM SB for 1 h and then challenged with 20 μM 6-OHDA for 16 h. Apoptosis in the 6-OHDA-treated group was normalized to 0%. Data are presented as mean ± SEM, and each value represents the mean of three replicates and six samples. * significantly different from the 6-OHDA group; (B) SH-SY5Y cells were pretreated with 0.1 nM SB for 1 h and then challenged with 20 μM 6-OHDA for 8 h. Hoechst 33342 stainings of the control, 6-OHDA, 6-OHDA plus SB, and SB alone groups are shown. The white arrows indicate the locations of chromatin condensation (scale bar = 100 μM); (C) Quantification of cytotoxicity in each group. Data are presented as mean ± SEM, and each value represents the mean of three replicates and three samples. *significantly different from the control group; # significantly different from the 6-OHDA group. p < 0.05