
Fig. 6
- ID
- ZDB-IMAGE-190808-26
- Publication
- Shamipour et al., 2019 - Bulk Actin Dynamics Drive Phase Segregation in Zebrafish Oocytes
- All Figures
- Figures for Shamipour et al., 2019
|
Fig. 6
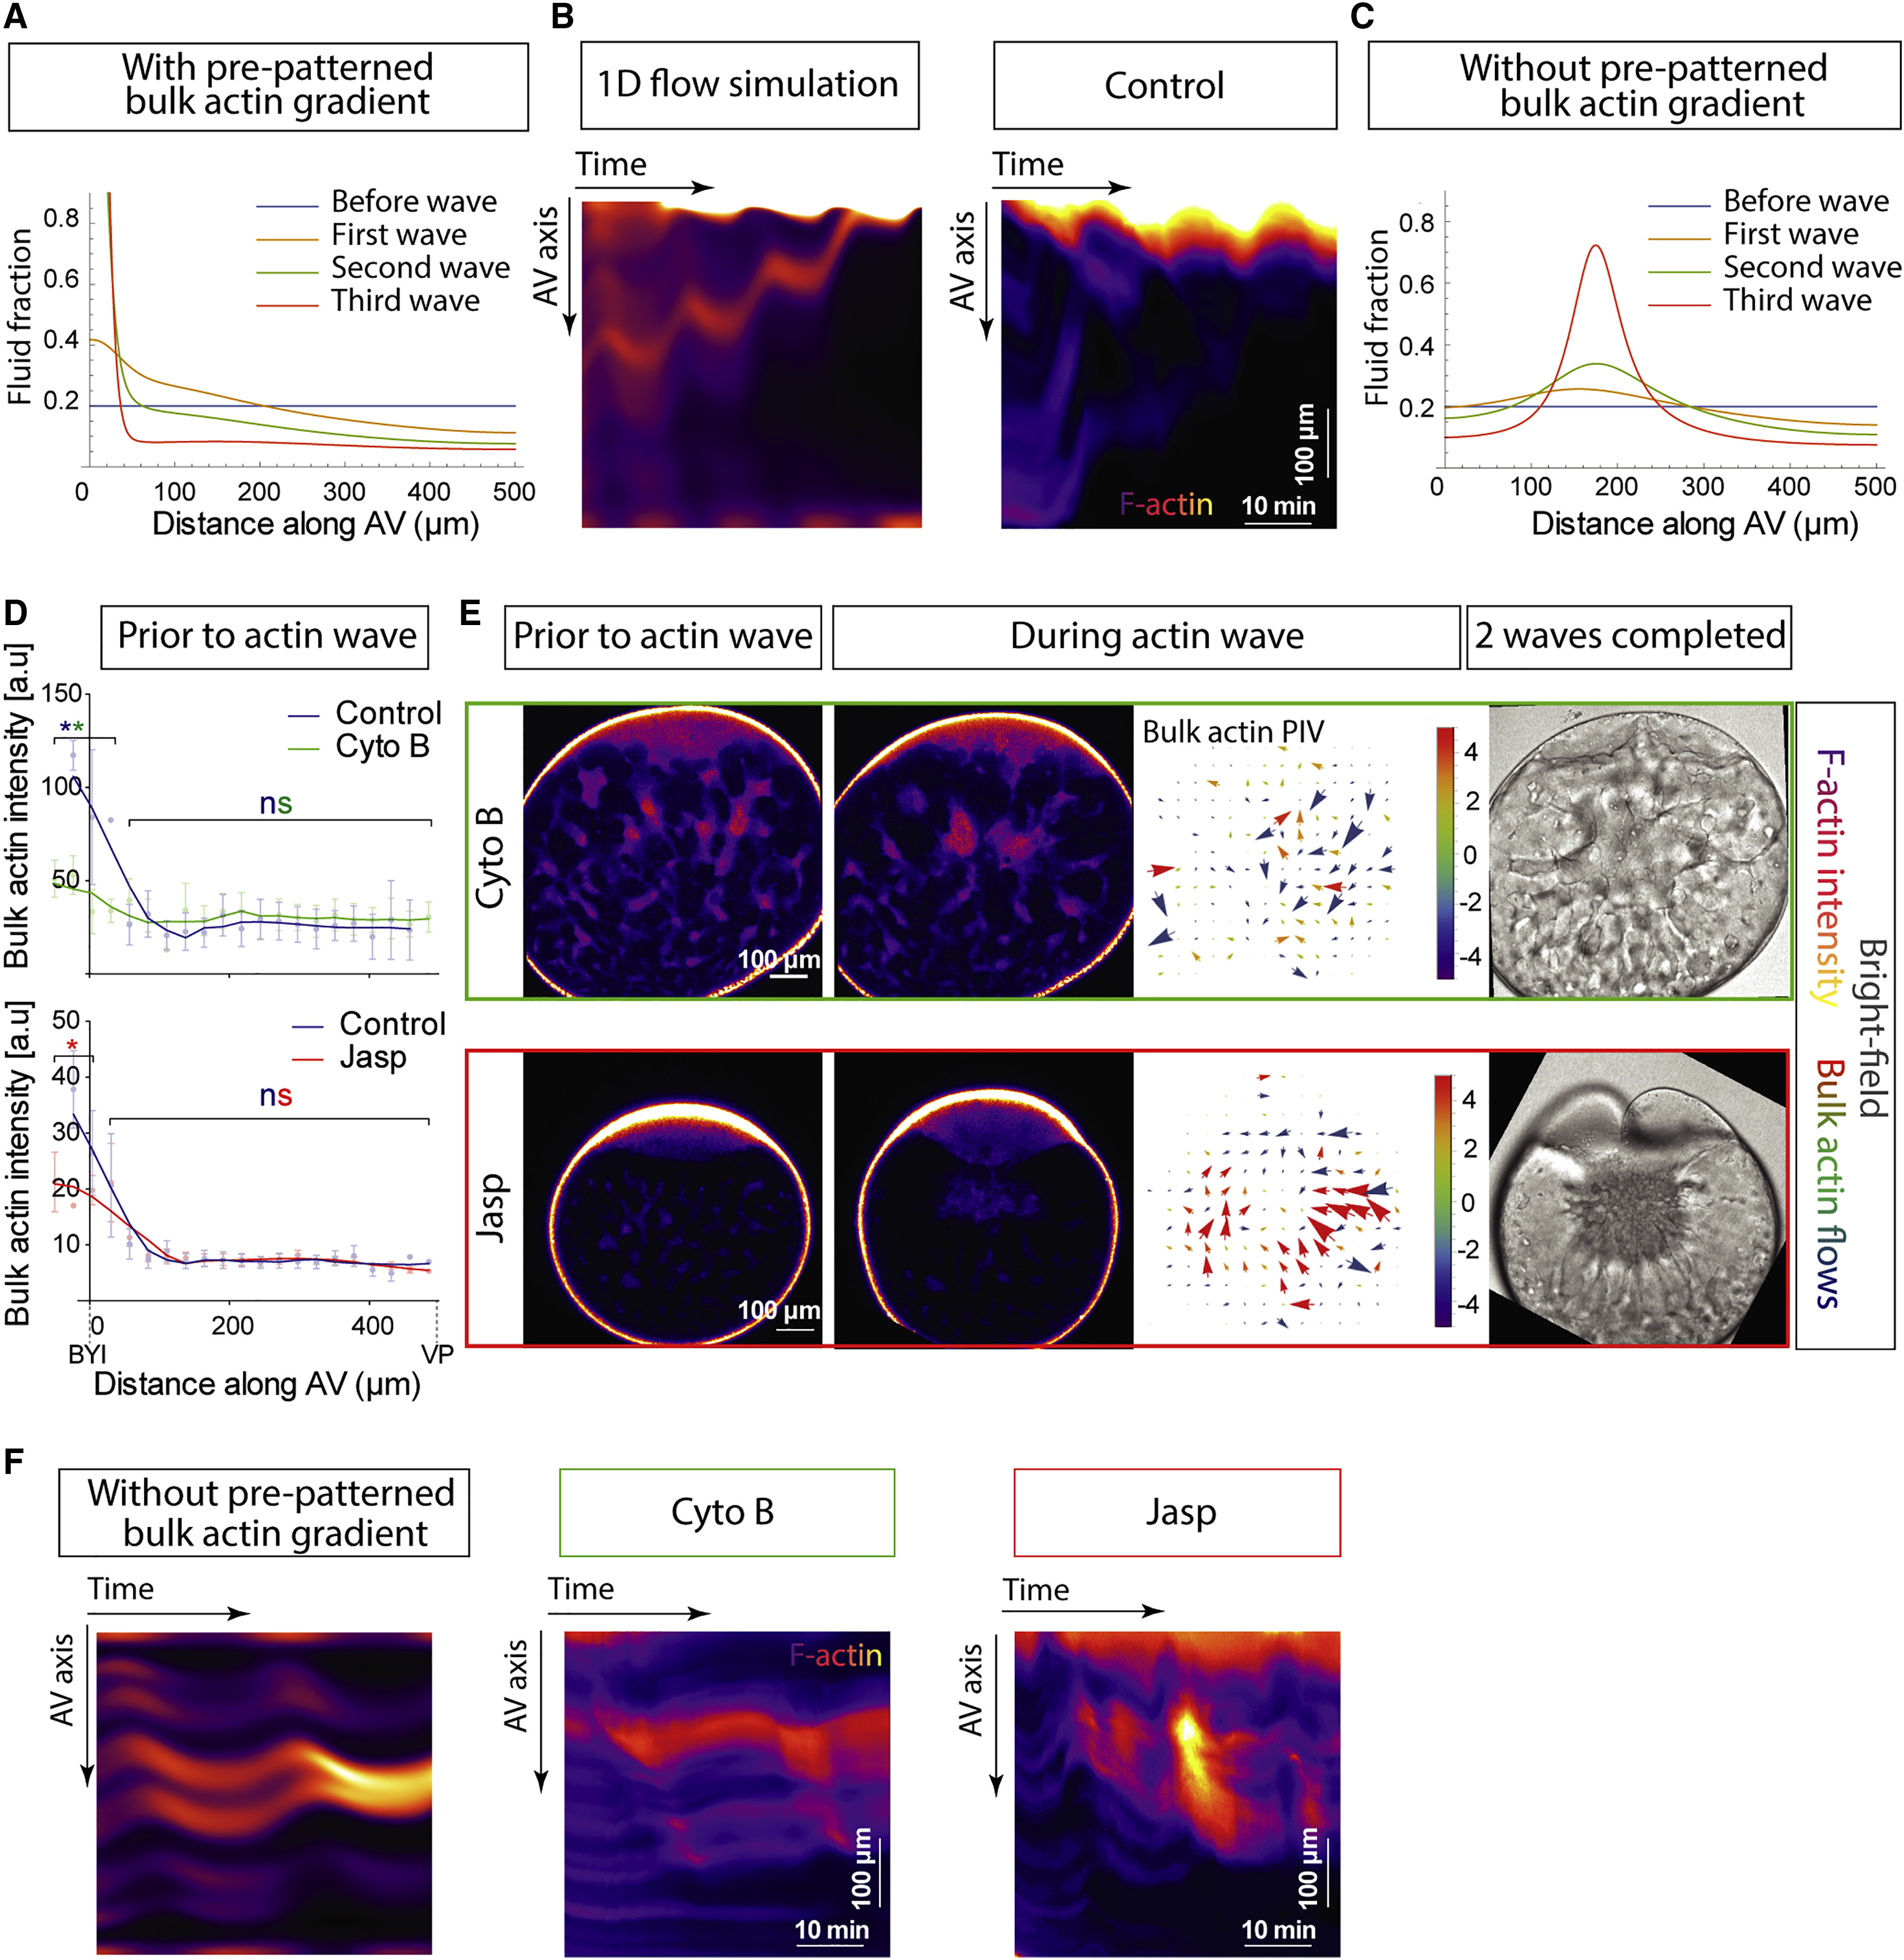
Generation and Directionality of F-Actin Flows within the Oocyte
(A) Theoretical prediction of fluid accumulation along the AV axis of the oocyte in the presence of a pre-patterned actin gradient.
(B) Theoretical (left) and experimental (right) kymographs of F-actin intensity along the AV axis of the oocyte during phase segregation. Numerical simulations were performed with a pre-patterned gradient of actin as in (A) and noisy initial conditions.
(C) Theoretical prediction of fluid accumulation along the animal-vegetal (AV) oocyte axis in the absence of a pre-patterned F-actin gradient.
(D) Bulk actin intensity along the AV oocyte axis prior to bulk actin polymerization wave formation for control (DMSO, blue, N = 3 experiments, n = 3 oocytes) and cytochalasin B-treated (CytoB, green, N = 3, n = 5) oocytes (top plot), and for control (DMSO, blue, N = 4, n = 6) and jasplakinolide-treated (Jasp, red, N = 5, n = 12) oocytes (bottom plot).
(E) Images (first two columns from the left) of oocytes expressing Utr-GFP to mark F-actin treated with CytoB (top row) and Jasp (bottom row) prior and during wave formation. Third column from the left: averaged velocity vector field of bulk actin flows during the first actin wave. + velocities, animalward flows; − negative velocities, vegetalward flows; in μm/min. Fourth column from the left: bright-field (BF) images of oocytes treated with CytoB (top panel) and Jasp (bottom panel) after the second cleavage.
(F) Theoretical (left, taken from the numerical simulations of C) and experimental (measured from E; treated with CytoB [middle] or Jasp [right]) kymographs of bulk actin intensity along the AV axis of oocytes as a function of time. Hot-to-cold color coding corresponds to high-to-low actin intensity.
Error bars, SEM. Mann-Whitney test, ns, not significant, ∗p = 0.0421, ∗∗p = 0.0054.
Reprinted from Cell, 177(6), Shamipour, S., Kardos, R., Xue, S.L., Hof, B., Hannezo, E., Heisenberg, C.P., Bulk Actin Dynamics Drive Phase Segregation in Zebrafish Oocytes, 1463-1479.e18, Copyright (2019) with permission from Elsevier. Full text @ Cell