
Fig. S4
- ID
- ZDB-IMAGE-190808-2
- Publication
- Ziyad et al., 2018 - A Forward Genetic Screen Targeting the Endothelium Reveals a Regulatory Role for the Lipid Kinase Pi4ka in Myelo- and Erythropoiesis
- All Figures
- Figures for Ziyad et al., 2018
|
Fig. S4
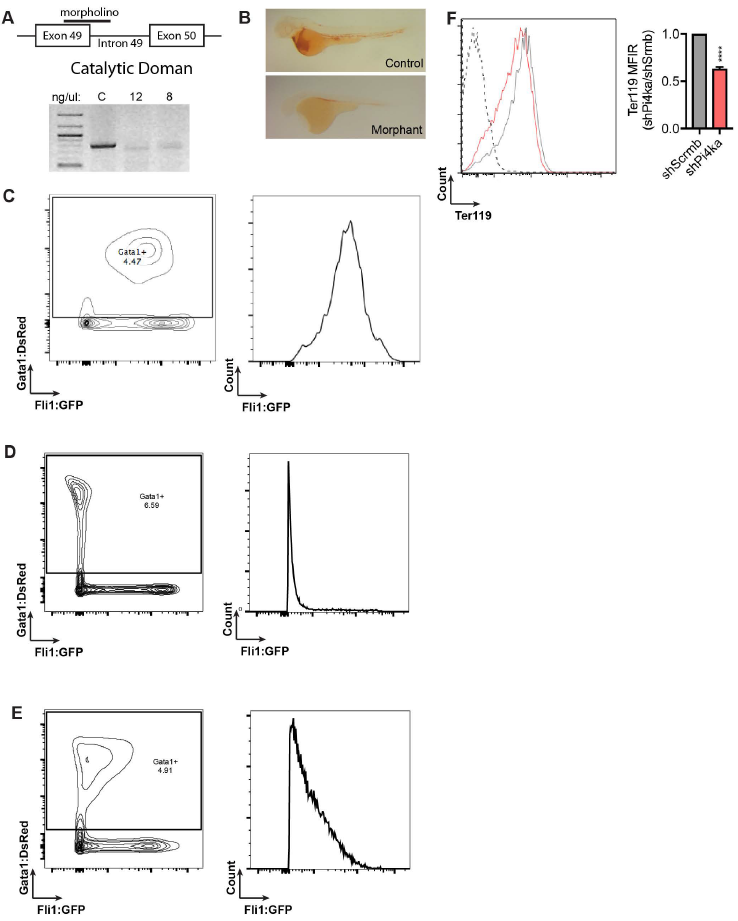
(A) Morpholino targeted splicing in the catalytic domain. PCR to access splicing efficiency. (B) O-dianisidine marking hemoglobin in control and morphant fish. (C) 24 hpf control injected embryos were subjected to flow cytometry and Gata1:DsRED+ was plotted against Fli1:GFP (left). Histogram of Gata1:DsRED+ cells as a subpopulation of Fli1:GFP cell population. (D,E) Identical gating performed on 48 hour control (top) and morphant embryos (bottom). (F) G1E-ER4 cell differentiation in the prescence of 4-hydroxytamoxifen (solid line) or ethenal control (dashed line). Cells were either pre-treated with non-targeted shRNA (grey) or Pi4ka targeted shRNA (red). Median fluorescence intensity (MFIR) was calculated as a ratio of MFI relative to shScrmb control. Statistical t-test comparing 3 independent experiments. (* p<0.05, **p<0.01, ***p<0.001, ****p<0.0001)