
Fig. S1
- ID
- ZDB-IMAGE-190808-19
- Publication
- Shamipour et al., 2019 - Bulk Actin Dynamics Drive Phase Segregation in Zebrafish Oocytes
- All Figures
- Figures for Shamipour et al., 2019
|
Fig. S1
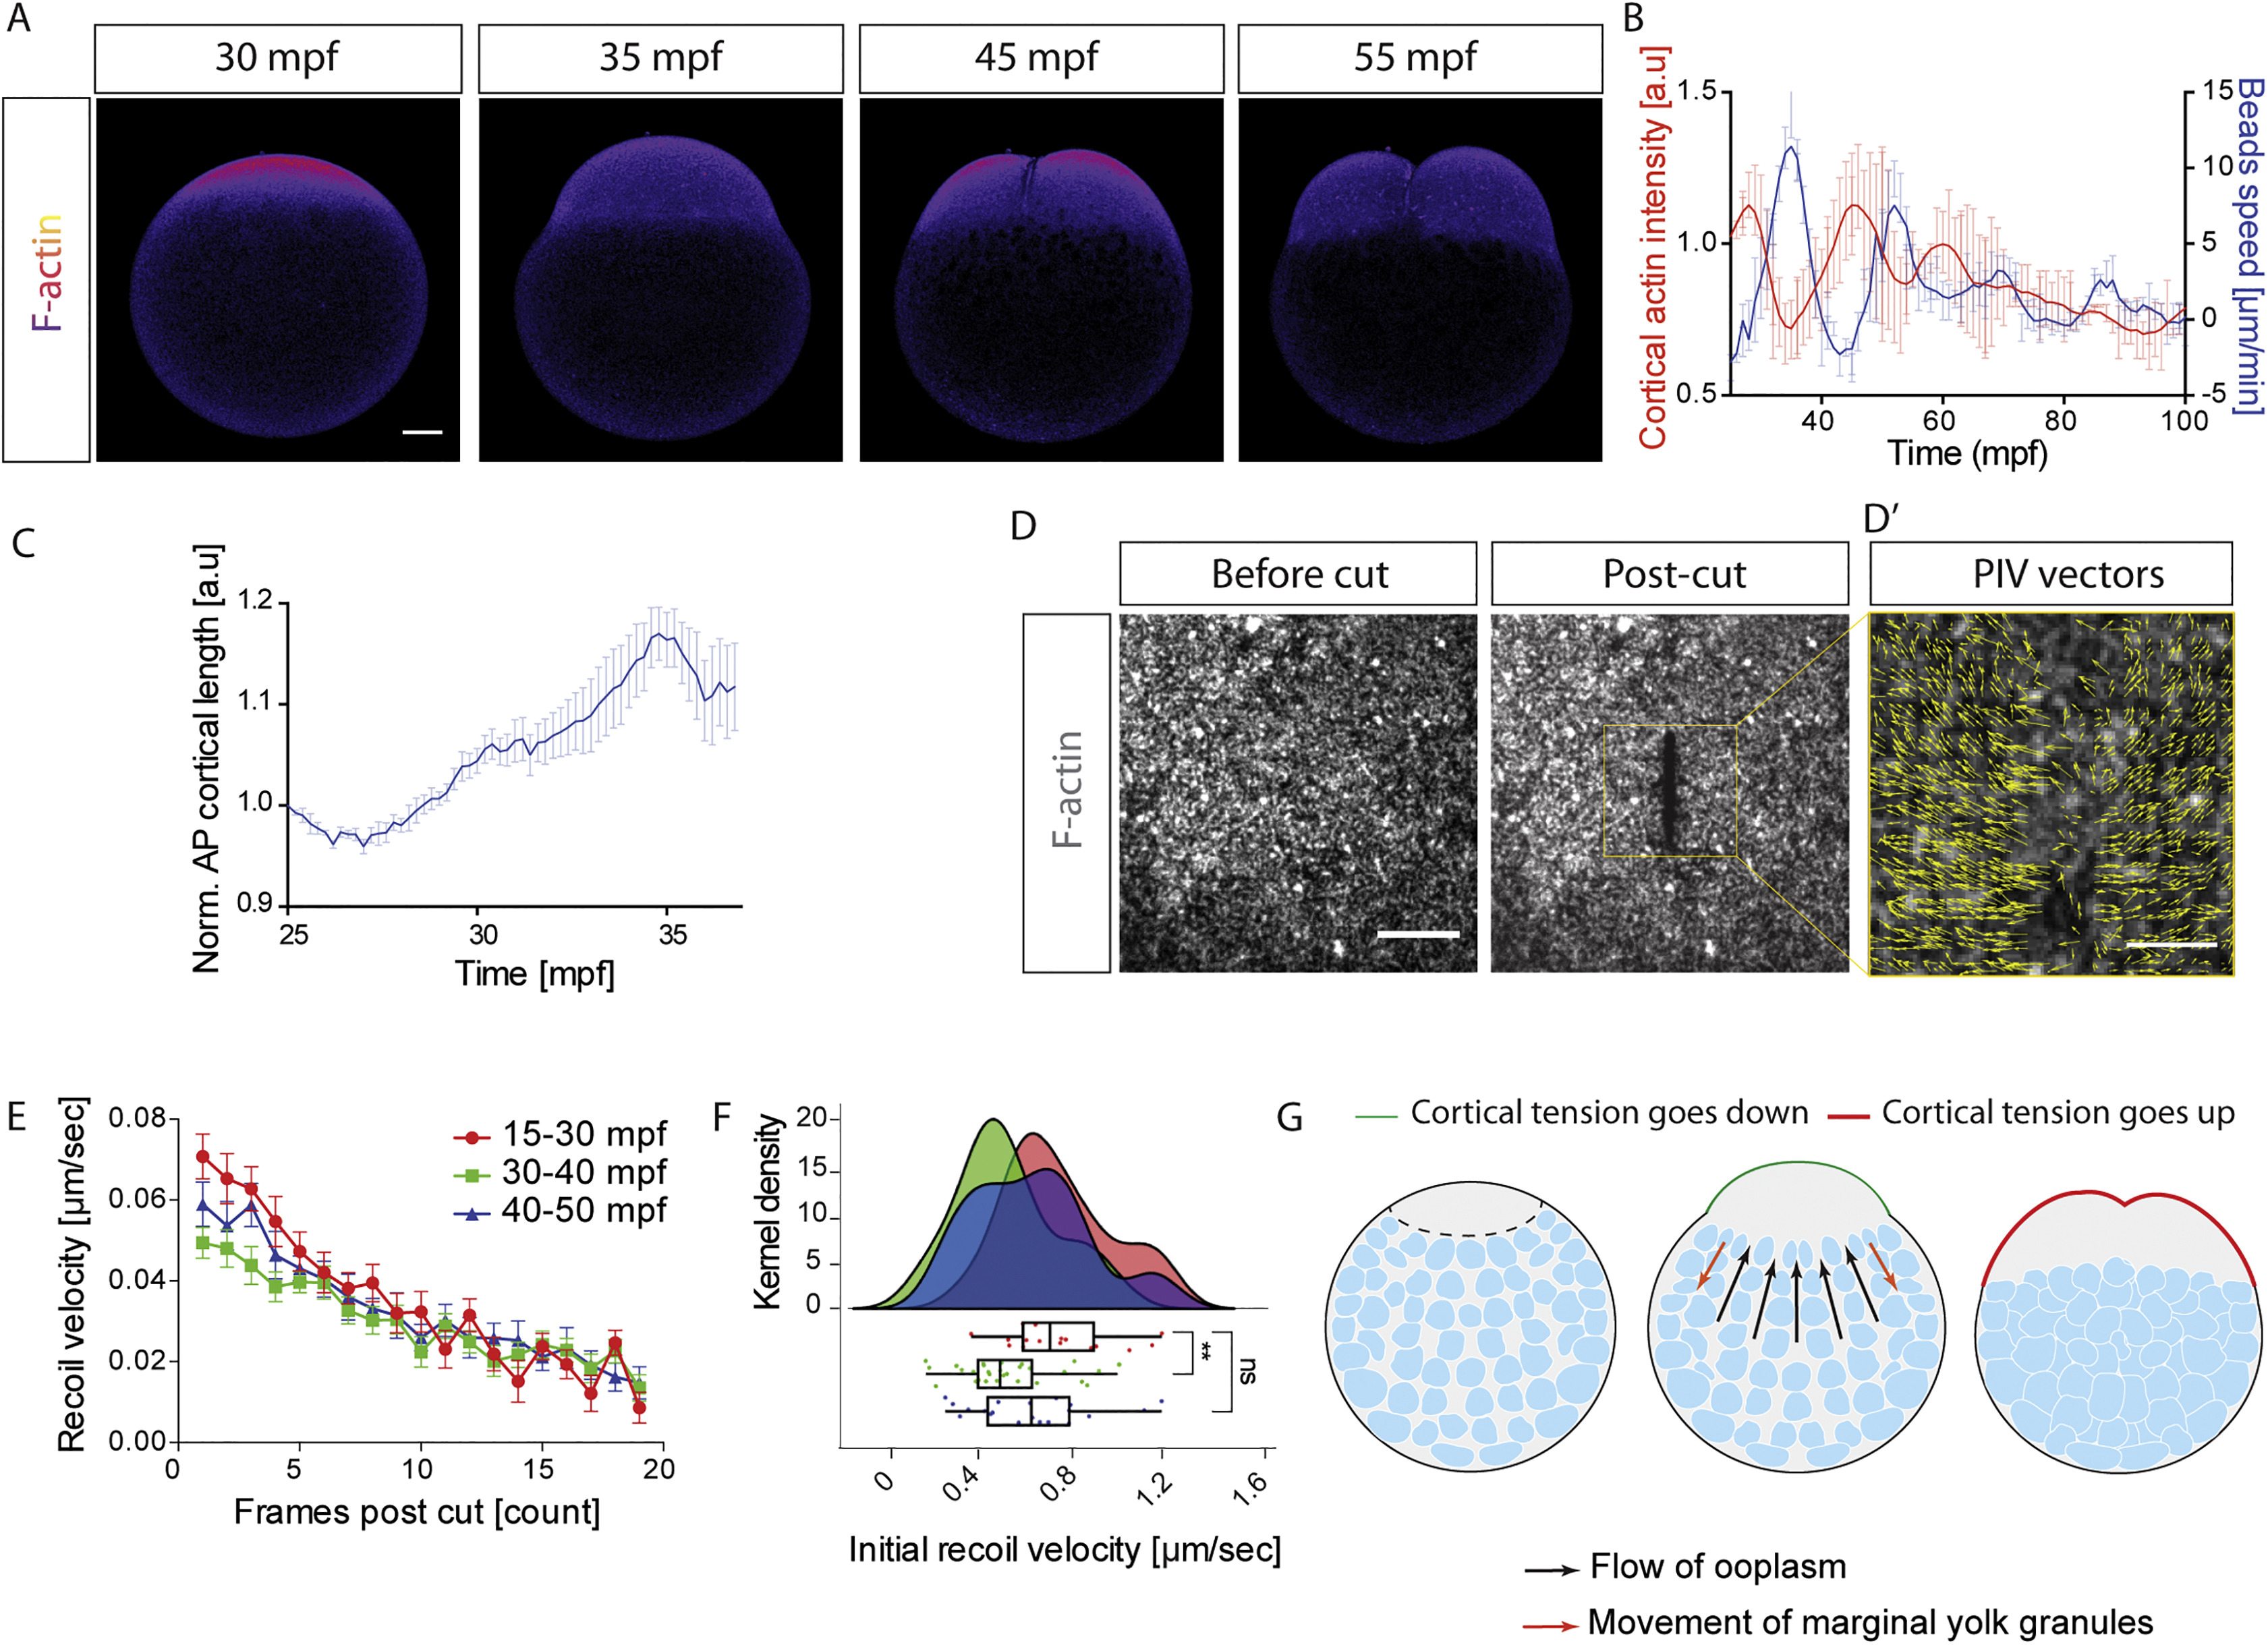
Spatiotemporal Correlation between Ooplasm Flows and Changes in Cortical Actomyosin, Related to Figure 2
(A) Fluorescence images of oocytes expressing Utr-GFP to mark F-actin. Scale bar, 50 μm. (B) Averaged cortical actin intensity (red, left y axis, N = 3 experiments, n = 3 oocytes) and beads speed as readout of ooplasm flows (blue, N = 3 experiments, n = 7 oocytes, taken from Figure 1C.) during the first 100 mpf. Error bars, SEM (C) Averaged length of the cortex at the animal pole (AP) of the oocyte as readout of animal pole deformation during the first ooplasm flow cycle. Error bars, SEM. N = 3 experiments, n = 6 oocytes. (D) Fluorescence images of UV laser cuts of the cortex at the animal pole of oocytes expressing Utr-GFP to mark F-actin. Left and right panels show cortex before and after the cut, respectively. Scale bar, 15 μm. (D’) particle image velocimetry (PIV) analysis of cortical flows surrounding the cut (outlined by golden box in middle panel) following the cut. Scale bar, 5 μm. (E) Recoil velocity of the actin cortex as a function of frames post cut (each frame is 200 ms) at 3 different stages of the oocyte: 15-30 mpf (red, before the first cycle of ooplasm flow), 30-40 mpf (green, during the first cycle of ooplasm flow), and 40-50 mpf (blue, after the first cycle of ooplasm flow). Error bars, SEM (F) Initial recoil velocities for the different conditions described in (E) calculated shown as kernel densities (top) and box whisker plots (bottom). Color codes are as described in (E). **p=0.0019, ns: not significant, Mann-Whitney test. (G) Schematic illustrating how changes in cortical tension at the animal pole of the oocyte could trigger ooplasm flows.
Reprinted from Cell, 177(6), Shamipour, S., Kardos, R., Xue, S.L., Hof, B., Hannezo, E., Heisenberg, C.P., Bulk Actin Dynamics Drive Phase Segregation in Zebrafish Oocytes, 1463-1479.e18, Copyright (2019) with permission from Elsevier. Full text @ Cell