
Fig. 2
- ID
- ZDB-IMAGE-190807-2
- Publication
- Talbot et al., 2019 - Muscle precursor cell movements in zebrafish are dynamic and require six-family genes
- All Figures
- Figures for Talbot et al., 2019
|
Fig. 2
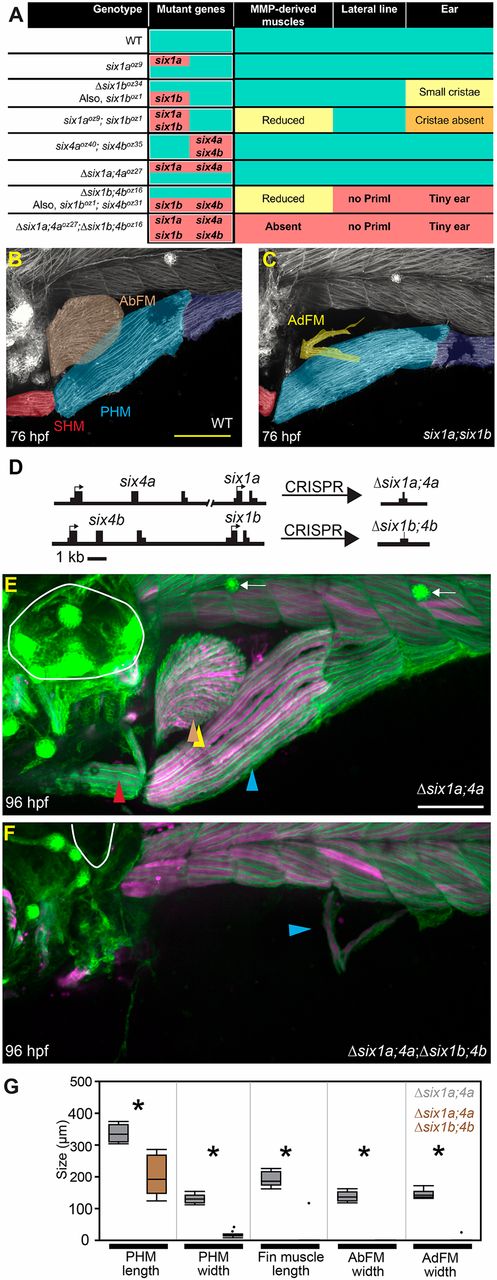
six1 and six4 genes are required for proper development of MMP-derived muscles and sensory tissues. (A) Summary of six1and six4 mutants generated for this study and their phenotypes. Green shading indicates normal phenotype that is indistinguishable from wild type (WT). Salmon shading indicates mutant genotypes and severe phenotypic defects. Milder defects are indicated by yellow or orange shading. ‘No PrimI’ indicates absence of the early-forming lateral line. (B,C) Three-day-old embryos labeled using six1b:lyn-GFP (white), false-colored to highlight different muscles. The SHM is red, the PHM is light blue anteriorly and dark blue posteriorly, and the AbFM is brown when present. The AbFM (brown), which covers the AdFM (yellow) in wild-type embryos (see B), is sometimes lost in six1a;six1b double mutants and in this example only a portion of the AdFM is present. (D) Diagram illustrating the six1-six4 genomic loci and Δsix1a;4a and Δsix1b;4bdeletion alleles. (E,F) Four-day-old embryos carrying the six1b:lyn-GFP (green) and fast muscle mylpfa:mCherry (magenta) transgenes, showing morphology of the ear (white circle), trunk neuromasts, if present (white arrows), and MMP-derived muscles (arrowheads). (E) Δsix1a;4a mutants are indistinguishable from wild-type embryos. (F) In contrast, MMP-derived muscles are almost entirely absent when all four Six genes are deleted. Additionally, Δsix1a;4a;Δsix1b;4b mutants lack trunk neuromasts and have severe ear defects (also see Figs S2 and S3). (G) Box plots of 96 hpf Six mutant MMP-derived muscle measurements. For all plots, ∆six1a;4a values are shown in gray and ∆six1a;4a;∆six1b;4b values are shown in brown. Measurements were taken on 11 ∆six1a;4a and 11 ∆six1a;4a;∆six1b;4b individuals. Asterisks indicate significant differences (P<0.01), determined by Tukey–Kramer HSD comparisons after one-way ANOVA. See Materials and Methods for statistical details. Arrowheads are color-coded as described in Fig. 1 legend. Scale bars: 100 μm (in B for B,C; in E for E,F).