
|
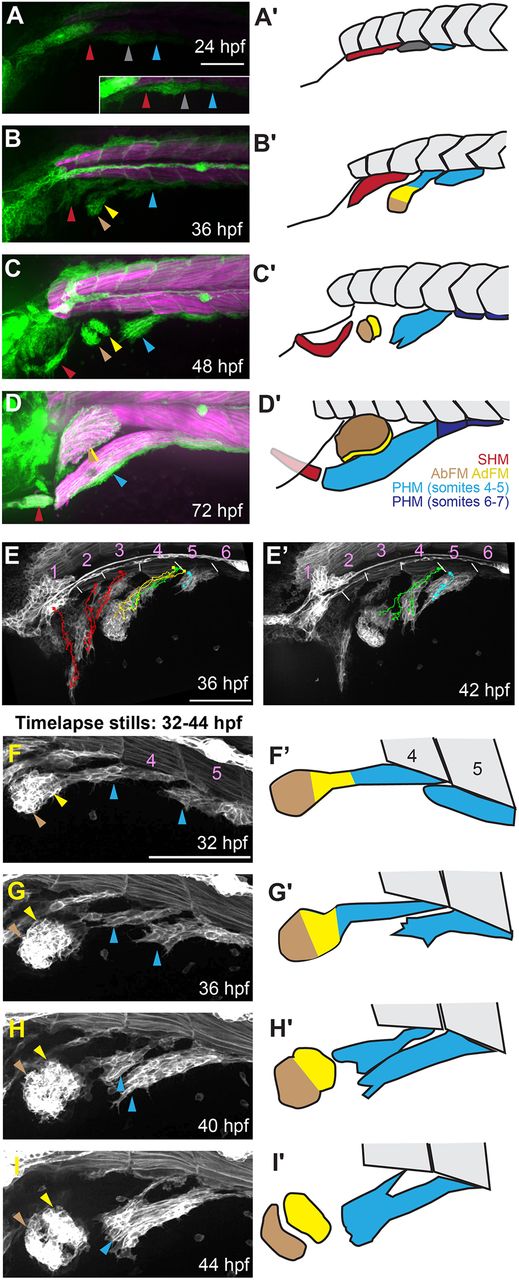
Fig. 1
Mapping MMP dynamics during migration. (A-D) MMPs are visualized using the transgenic marker six1b:lyn-GFP (green) and the fast muscle marker mylpfa:mCherry (magenta), fixed at the onset of streaming (24 hpf) (A), during migration (36 hpf) (B), prior to MMP differentiation (48 hpf) (C) and when muscle differentiation is well underway (76 hpf) (D). The inset in A is brightened to compensate for dim transgene expression at 24 hpf. (A′-D′) Schematics of MMP migratory patterns, with a color code depicting MMPs that will contribute to more than one muscle (dark gray), or to SHM (red), AbFM (brown), AdFM (yellow), or the portion of the PHM formed by MMPs from somites 4 and 5 (light blue). Posterior to somite 5 (dark blue), PHM fibers arise via short-range migration and abide by somite boundaries. (E,E′) Stills from a time-lapse (Movie 1) of six1b:lyn-GFP-expressing MMPs, overlaid with cell tracks. Track colors are based on which muscle the cells will eventually contribute to the SHM (red), AbFM (brown), AdFM (yellow), PHM (blue), or to both PHM and AdFM (green). Starting cell positions are marked with squares, current cell positions are marked with dots and intermediate positions are tracked with lines. White lines indicate somite boundaries. (E) Tracks to 36 hpf, showing contributions to SHM and fin muscles. (E′) A later time frame (42 hpf), with cell tracks showing that a single cell (green) can contribute to both the AdFM and the PHM. (F-I) Stills from a time-lapse of six1b:lyn-GFP-expressing MMPs (Movie 2) show that the second MMP stream produces the AbFM and AdFM and contributes to the PHM. (F′-I′) Schematics of time-lapse stills. In all figures and schematics, colored arrowheads and shading indicate different streams and the muscles they form. Dark gray indicates MMPs that will contribute to more than one muscle, red indicates the SHM and its precursors, brown indicates the AbFM and its precursors, yellow indicates the AdFM and its precursors, and light blue indicates the PHM and its precursors. Scale bars: 100 µm (in A for A-D; in E for E,E′; in F for F-I).